
Page 293 - Design for Environment A Guide to Sustainable Product Development
P. 293
Medical and Pharmaceutical Industries 269
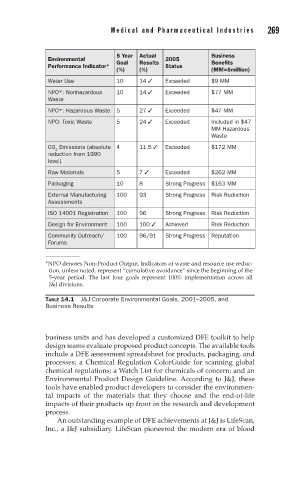
5 Year Actual Business
Environmental 2005
Goal Results Benefits
Performance Indicator* Status
(%) (%) (MM=$million)
Water Use 10 14 Exceeded $9 MM
NPO*: Nonhazardous 10 14 Exceeded $77 MM
Waste
NPO*: Hazardous Waste 5 27 Exceeded $47 MM
NPO: Toxic Waste 5 24 Exceeded Included in $47
MM Hazardous
Waste
CO Emissions (absolute 4 11.5 Exceeded $172 MM
2
reduction from 1990
level)
Raw Materials 5 7 Exceeded $262 MM
Packaging 10 8 Strong Progress $163 MM
External Manufacturing 100 93 Strong Progress Risk Reduction
Assessments
ISO 14001 Registration 100 96 Strong Progress Risk Reduction
Design for Environment 100 100 Achieved Risk Reduction
Community Outreach/ 100 96/91 Strong Progress Reputation
Forums
*NPO denotes Non-Product Output. Indicators of waste and resource use reduc-
tion, unless noted, represent “cumulative avoidance” since the beginning of the
5-year period. The last four goals represent 100% implementation across all
J&J divisions.
TABLE 14.1 J&J Corporate Environmental Goals, 2001–2005, and
Business Results
business units and has developed a customized DFE toolkit to help
design teams evaluate proposed product concepts. The available tools
include a DFE assessment spreadsheet for products, packaging, and
processes; a Chemical Regulation ColorGuide for scanning global
chemical regulations; a Watch List for chemicals of concern; and an
Environmental Product Design Guideline. According to J&J, these
tools have enabled product developers to consider the environmen-
tal impacts of the materials that they choose and the end-of-life
impacts of their products up front in the research and development
process.
An outstanding example of DFE achievements at J&J is LifeScan,
Inc., a J&J subsidiary. LifeScan pioneered the modern era of blood