
Page 102 - Design for Six Sigma a Roadmap for Product Development
P. 102
Product Development Process and Design for Six Sigma 77
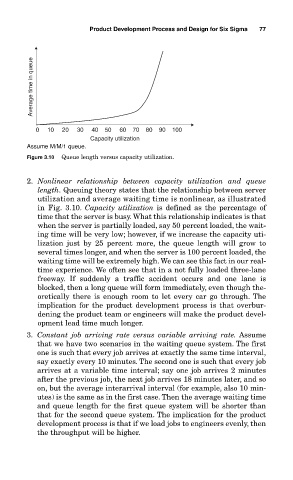
Average time in queue
0 10 20 30 40 50 60 70 80 90 100
Capacity utilization
Assume M/M/1 queue.
Figure 3.10 Queue length versus capacity utilization.
2. Nonlinear relationship between capacity utilization and queue
length. Queuing theory states that the relationship between server
utilization and average waiting time is nonlinear, as illustrated
in Fig. 3.10. Capacity utilization is defined as the percentage of
time that the server is busy. What this relationship indicates is that
when the server is partially loaded, say 50 percent loaded, the wait-
ing time will be very low; however, if we increase the capacity uti-
lization just by 25 percent more, the queue length will grow to
several times longer, and when the server is 100 percent loaded, the
waiting time will be extremely high. We can see this fact in our real-
time experience. We often see that in a not fully loaded three-lane
freeway. If suddenly a traffic accident occurs and one lane is
blocked, then a long queue will form immediately, even though the-
oretically there is enough room to let every car go through. The
implication for the product development process is that overbur-
dening the product team or engineers will make the product devel-
opment lead time much longer.
3. Constant job arriving rate versus variable arriving rate. Assume
that we have two scenarios in the waiting queue system. The first
one is such that every job arrives at exactly the same time interval,
say exactly every 10 minutes. The second one is such that every job
arrives at a variable time interval; say one job arrives 2 minutes
after the previous job, the next job arrives 18 minutes later, and so
on, but the average interarrival interval (for example, also 10 min-
utes) is the same as in the first case. Then the average waiting time
and queue length for the first queue system will be shorter than
that for the second queue system. The implication for the product
development process is that if we load jobs to engineers evenly, then
the throughput will be higher.