
Page 431 - Design for Six Sigma a Roadmap for Product Development
P. 431
Failure Mode–Effect Analysis 395
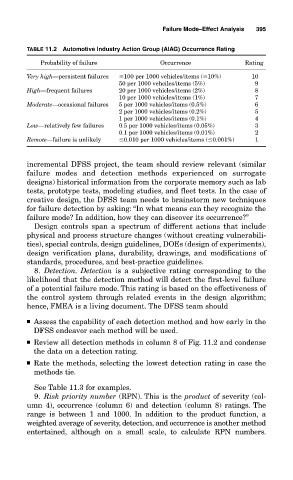
TABLE 11.2 Automotive Industry Action Group (AIAG) Occurrence Rating
Probability of failure Occurrence Rating
Very high—persistent failures 100 per 1000 vehicles/items ( 10%) 10
50 per 1000 vehciles/items (5%) 9
High—frequent failures 20 per 1000 vehicles/items (2%) 8
10 per 1000 vehicles/items (1%) 7
Moderate—occasional failures 5 per 1000 vehicles/items (0.5%) 6
2 per 1000 vehicles/items (0.2%) 5
1 per 1000 vehicles/items (0.1%) 4
Low—relatively few failures 0.5 per 1000 vehicles/items (0.05%) 3
0.1 per 1000 vehicles/items (0.01%) 2
Remote—failure is unlikely 0.010 per 1000 vehicles/items ( 0.001%) 1
incremental DFSS project, the team should review relevant (similar
failure modes and detection methods experienced on surrogate
designs) historical information from the corporate memory such as lab
tests, prototype tests, modeling studies, and fleet tests. In the case of
creative design, the DFSS team needs to brainstorm new techniques
for failure detection by asking: “In what means can they recognize the
failure mode? In addition, how they can discover its occurrence?”
Design controls span a spectrum of different actions that include
physical and process structure changes (without creating vulnerabili-
ties), special controls, design guidelines, DOEs (design of experiments),
design verification plans, durability, drawings, and modifications of
standards, procedures, and best-practice guidelines.
8. Detection. Detection is a subjective rating corresponding to the
likelihood that the detection method will detect the first-level failure
of a potential failure mode. This rating is based on the effectiveness of
the control system through related events in the design algorithm;
hence, FMEA is a living document. The DFSS team should
■ Assess the capability of each detection method and how early in the
DFSS endeavor each method will be used.
■ Review all detection methods in column 8 of Fig. 11.2 and condense
the data on a detection rating.
■ Rate the methods, selecting the lowest detection rating in case the
methods tie.
See Table 11.3 for examples.
9. Risk priority number (RPN). This is the product of severity (col-
umn 4), occurrence (column 6) and detection (column 8) ratings. The
range is between 1 and 1000. In addition to the product function, a
weighted average of severity, detection, and occurrence is another method
entertained, although on a small scale, to calculate RPN numbers.