
Page 45 - Design for Six Sigma a Roadmap for Product Development
P. 45
Six Sigma and Lean Fundamentals 23
Materials
Procedures
Methods
Products
Information
(including
specifications)
People Services
Process
Skills
Information
Knowledge
Training
Paperwork
Plant/
equipment
Inputs Outputs
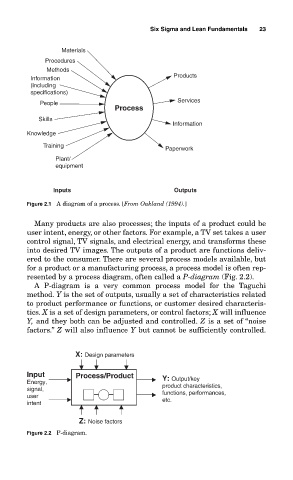
Figure 2.1 A diagram of a process. [From Oakland (1994).]
Many products are also processes; the inputs of a product could be
user intent, energy, or other factors. For example, a TV set takes a user
control signal, TV signals, and electrical energy, and transforms these
into desired TV images. The outputs of a product are functions deliv-
ered to the consumer. There are several process models available, but
for a product or a manufacturing process, a process model is often rep-
resented by a process diagram, often called a P-diagram (Fig. 2.2).
A P-diagram is a very common process model for the Taguchi
method. Y is the set of outputs, usually a set of characteristics related
to product performance or functions, or customer desired characteris-
tics. X is a set of design parameters, or control factors; X will influence
Y, and they both can be adjusted and controlled. Z is a set of “noise
factors.” Z will also influence Y but cannot be sufficiently controlled.
X: Design parameters
Input Process/Product
Energy, Y: Output/key
signal, product characteristics,
user functions, performances,
intent etc.
Z: Noise factors
Figure 2.2 P-diagram.