
Page 524 - Design for Six Sigma a Roadmap for Product Development
P. 524
Taguchi’s Orthogonal Array Experiment 483
However, in the compound factor method, there is a partial loss of orthogo-
nality. The two compound factors are not orthogonal to each other, but each
of them is orthogonal to other factors in the experiment.
13.4 Taguchi Experiment Data Analysis
There are many similarities between the data analysis of the Taguchi
experiment and “classical” design of experiment.
In Taguchi experimental data analysis, the following three items are
very important:
1. Analysis of variance (ANOVA)
2. Main-effects chart and interaction chart
3. Optimization and prediction of expected response
13.4.1 Analysis of variance
There is actually no difference between analysis of variance of classical
DOE and Taguchi DOE. First, we compute the sum of squares (SS), then
the mean squares (MS), where an MS is computed by dividing the SS by
the degree of freedom. In Taguchi DOE, the F test is not as important as
that of classical DOE. Sometimes, the relative importance of each factor
is computed by its percentage contribution to the total sum of squares.
For each column of an orthogonal array, assume that there are k
levels, and for each level t, the total sum of response at tth level is rep-
resented by T t , the total sum of responses is represented by T, the total
number of runs is N, and the number of replicates is n; then for each
column, the sum of squares is
k k T 2
2
SS
T t (13.1)
N
n t 1 N
n
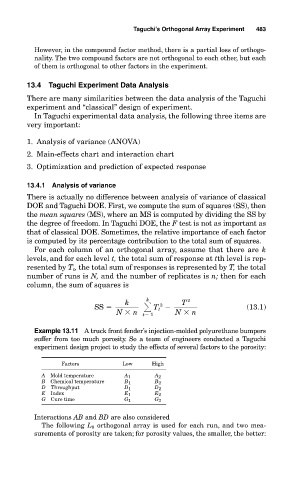
Example 13.11 A truck front fender’s injection-molded polyurethane bumpers
suffer from too much porosity. So a team of engineers conducted a Taguchi
experiment design project to study the effects of several factors to the porosity:
Factors Low High
A Mold temperature A 1 A 2
B Chemical temperature B 1 B 2
D Throughput D 1 D 2
E Index E 1 E 2
G Cure time G 1 G 2
Interactions AB and BD are also considered
The following L 8 orthogonal array is used for each run, and two mea-
surements of porosity are taken; for porosity values, the smaller, the better: