Page 528 - Design for Six Sigma a Roadmap for Product Development
P. 528

Taguchi’s Orthogonal Array Experiment  487


                        3                     T  2
                                        2
                SS B       (T 2    T 2    T )
                      9 
 1  B 1   B 2  B 3  9 
 1
                      3
                                                                   2
                                    2
                                                    2
                         [(8   11   21)   (12   12   18)   (9   15   20) ]
                      9
                        1
                           (8   12   9   11   12   15   21   18   20) 2
                        9
                      2.667
             Similarly
                SS C   18.667
                       2
                                                 2
                                            2
                                                      2
                                                                 2
                                                            2
                             2
                                 2
                                      2
                SS T   [8   12   9   11   12   15   21   18   20 ]
                        1
                           (8   12   9   11   12   15   21   18   20) 2
                        9
                      180
             Using MINITAB, we get the following ANOVA table:
             Source    DF        Seq SS         Adj SS       Adj MS      F    P
             A          2       158.000        158.000       79.000     **
             B          2         2.667          2.667        1.333     **
             C          2        18.667         18.667        9.333     **
             Error      2         0.667          0.667        0.333
             Total      8       180.000
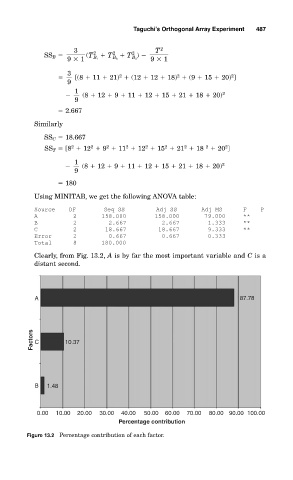
             Clearly, from Fig. 13.2, A is by far the most important variable and C is a
             distant second.


              A                                                      87.78


             Factors  C  10.37


              B  1.48


              0.00  10.00  20.00  30.00  40.00  50.00  60.00  70.00  80.00 90.00 100.00
                                    Percentage contribution
           Figure 13.2 Percentage contribution of each factor.
   523   524   525   526   527   528   529   530   531   532   533