Page 530 - Design for Six Sigma a Roadmap for Product Development
P. 530

Taguchi’s Orthogonal Array Experiment  489


                   18


                   13
                Porosity


                    8


                    3

                       1                                2
                                        A


                     A         G        D         B        E
              17
              14
             Porosity  11

               8
               5

                   1      2  1      2  1     2  1     2  1      2
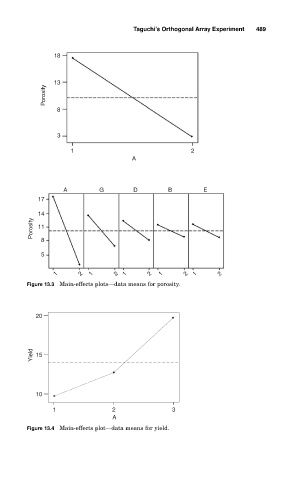
           Figure 13.3 Main-effects plots—data means for porosity.


              20


             Yield  15


              10

                  1                2               3
                                   A
           Figure 13.4 Main-effects plot—data means for yield.
   525   526   527   528   529   530   531   532   533   534   535