
Page 532 - Design for Six Sigma a Roadmap for Product Development
P. 532
Taguchi’s Orthogonal Array Experiment 491
90 percent of percentage contribution. From the F test, we can find
that A, G, and interaction BD are statistically significant. (If we go with
percentage contribution, then A,G,BD, error, and AB are top contributors,
with a cumulative percentage contribution of 92.56 percent.)
The main-effects chart and BD interaction chart indicate that A and
G should be set at level 2 (from main-effects chart). According to the
BD interaction chart, B should be at least 1 and D at level 2.
The optimal response prediction in this problem is given by
^ 2T 2.875 6.875 5.75 2
y y A 2 y G 2 y B 1 D 2
10.188 4.873
where T T/(N
n) 163/(8
2) 10.188 is the average response
for the experiment.
For Examples 13.12 and 13.14, we cannot use an F test because
there is insufficient degree of freedom for error to conduct a meaning-
ful test. If we use percentage contribution, factors A and C have a
cumulative contribution of 98.15 percent, from the main-effects chart
in Fig. 13.5, we can determine that A should be at level 3 and C should
^ T 19.67
be at level 2. The estimated optimal yield is y y A 3 y C 2
16 14 21.67.
13.5 Summary
1. Taguchi experimental design uses standard orthogonal arrays, with
the help of a linear graph, an interaction table, and special tech-
niques. A Taguchi experiment considers only main effects and some
predetermined two-factor interactions, as higher-order interactions
are assumed to be nonexistent.
2. Taguchi experimental data analysis includes
■ ANOVA
■ Main-effects chart and interaction chart
■ Best factor level selection and optimal performance level prediction
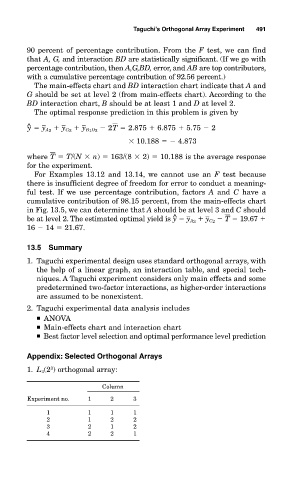
Appendix: Selected Orthogonal Arrays
1. L 4 (2 ) orthogonal array:
3
Column
Experiment no. 1 2 3
1 1 1 1
2 1 2 2
3 2 1 2
4 2 2 1