
Page 531 - Design for Six Sigma a Roadmap for Product Development
P. 531
490 Chapter Thirteen
A B C
20.0
17.5
Yield 15.0
12.5
10.0
1 2 3 1 2 3 1 2 3
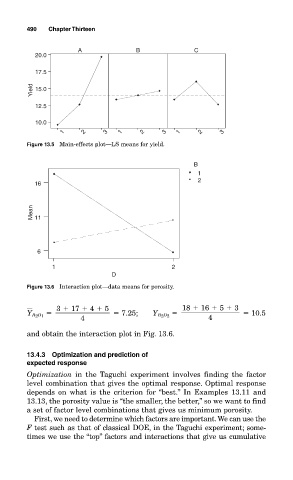
Figure 13.5 Main-effects plot—LS means for yield.
B
1
2
16
Mean 11
6
1 2
D
Figure 13.6 Interaction plot—data means for porosity.
3 17 4 5 18 16 5 3
7.25; 10.5
Y B 2 D 1 Y B 2 D 2
4 4
and obtain the interaction plot in Fig. 13.6.
13.4.3 Optimization and prediction of
expected response
Optimization in the Taguchi experiment involves finding the factor
level combination that gives the optimal response. Optimal response
depends on what is the criterion for “best.” In Examples 13.11 and
13.13, the porosity value is “the smaller, the better,” so we want to find
a set of factor level combinations that gives us minimum porosity.
First, we need to determine which factors are important.We can use the
F test such as that of classical DOE, in the Taguchi experiment; some-
times we use the “top” factors and interactions that give us cumulative