
Page 526 - Design for Six Sigma a Roadmap for Product Development
P. 526
Taguchi’s Orthogonal Array Experiment 485
Actually, MINITAB will give exactly the same result. The ANOVA table is
given as follows:
Analysis of Variance for Porosity, using Adjusted SS for Tests
Source DF Seq SS Adj SS Adj MS F P
A 1 855.56 855.56 855.56 28.82 0.001
B 1 27.56 27.56 27.56 0.93 0.363
AB 1 115.56 115.56 115.56 3.89 0.084
D 1 68.06 68.06 68.06 2.29 0.168
E 1 33.06 33.06 33.06 1.11 0.322
BD 1 217.56 217.56 217.56 7.33 0.027
G 1 175.56 175.56 175.56 5.91 0.041
Error 8 237.50 237.50 29.69
Total 15 1730.44
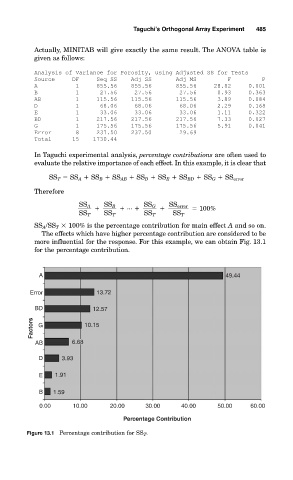
In Taguchi experimental analysis, percentage contributions are often used to
evaluate the relative importance of each effect. In this example, it is clear that
SS T SS A SS B SS AB SS D SS E SS BD SS G SS error
Therefore
SS A
SS B
SS error
SS G
... 100%
SS T SS T SS T SS T
SS A /SS T
100% is the percentage contribution for main effect A and so on.
The effects which have higher percentage contribution are considered to be
more influential for the response. For this example, we can obtain Fig. 13.1
for the percentage contribution.
A 49.44
Error 13.72
BD 12.57
Factors G 10.15
AB 6.68
D 3.93
E 1.91
B 1.59
0.00 10.00 20.00 30.00 40.00 50.00 60.00
Percentage Contribution
Figure 13.1 Percentage contribution for SS T .