
Page 188 - Design for Six Sigma for Service (Six SIGMA Operational Methods)
P. 188
160 Chapter Seven
Why Produce How?
flame
Ignite Produce Ignite
cigarette flame fuel
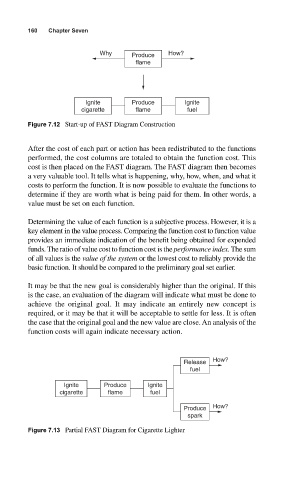
Figure 7.12 Start-up of FAST Diagram Construction
After the cost of each part or action has been redistributed to the functions
performed, the cost columns are totaled to obtain the function cost. This
cost is then placed on the FAST diagram. The FAST diagram then becomes
a very valuable tool. It tells what is happening, why, how, when, and what it
costs to perform the function. It is now possible to evaluate the functions to
determine if they are worth what is being paid for them. In other words, a
value must be set on each function.
Determining the value of each function is a subjective process. However, it is a
key element in the value process. Comparing the function cost to function value
provides an immediate indication of the benefit being obtained for expended
funds. The ratio of value cost to function cost is the performance index. The sum
of all values is the value of the system or the lowest cost to reliably provide the
basic function. It should be compared to the preliminary goal set earlier.
It may be that the new goal is considerably higher than the original. If this
is the case, an evaluation of the diagram will indicate what must be done to
achieve the original goal. It may indicate an entirely new concept is
required, or it may be that it will be acceptable to settle for less. It is often
the case that the original goal and the new value are close. An analysis of the
function costs will again indicate necessary action.
Release How?
fuel
Ignite Produce Ignite
cigarette flame fuel
Produce How?
spark
Figure 7.13 Partial FAST Diagram for Cigarette Lighter