
Page 193 - Design for Six Sigma for Service (Six SIGMA Operational Methods)
P. 193
164 Chapter Seven
Function number
Cost
3 $4.69
Plan
treatment
$4.07
Best cost
Function name
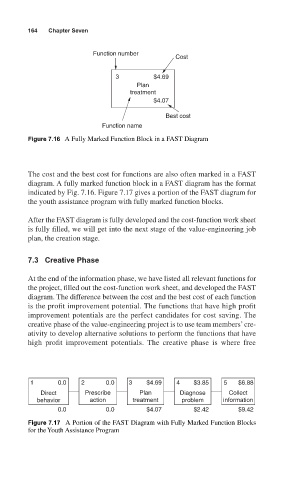
Figure 7.16 A Fully Marked Function Block in a FAST Diagram
The cost and the best cost for functions are also often marked in a FAST
diagram. A fully marked function block in a FAST diagram has the format
indicated by Fig. 7.16. Figure 7.17 gives a portion of the FAST diagram for
the youth assistance program with fully marked function blocks.
After the FAST diagram is fully developed and the cost-function work sheet
is fully filled, we will get into the next stage of the value-engineering job
plan, the creation stage.
7.3 Creative Phase
At the end of the information phase, we have listed all relevant functions for
the project, filled out the cost-function work sheet, and developed the FAST
diagram. The difference between the cost and the best cost of each function
is the profit improvement potential. The functions that have high profit
improvement potentials are the perfect candidates for cost saving. The
creative phase of the value-engineering project is to use team members’cre-
ativity to develop alternative solutions to perform the functions that have
high profit improvement potentials. The creative phase is where free
1 0.0 2 0.0 3 $4.69 4 $3.85 5 $6.88
Direct Prescribe Plan Diagnose Collect
behavior action treatment problem information
0.0 0.0 $4.07 $2.42 $9.42
Figure 7.17 A Portion of the FAST Diagram with Fully Marked Function Blocks
for the Youth Assistance Program