
Page 396 - Design for Six Sigma for Service (Six SIGMA Operational Methods)
P. 396
356 Chapter Ten
considered to be a visual aid for picturing work processes which show how
inputs, outputs and tasks are linked” (Anjard 1998). Process mapping is
used to develop a process map for the process under study. There are a
number of different methods of process mapping; these methods include a
process flowchart, IDEF0 process mapping, and value stream mapping. In
this section, we are going to discuss these three methods in detail.
10.4.1 Process Flowchart
The flowchart is a graphic way to describe a group of activities in a process.
The basic purpose of the flowchart is to provide a graphical representation of
all the activities performed in the sequence in which they are actually
conducted. One advantage of the graphical flowchart is the ease with which
the activities in the process and their relationships can be visualized and
understood. However, a flowchart alone usually does not provide enough
level of detail for each activity. Therefore, supplementary writing procedures
for all activities are also provided with the flowchart to provide the details.
Flowcharts use symbols connected by arrows to describe processes. The
commonly used flowchart symbols are illustrated in Table 10.1.
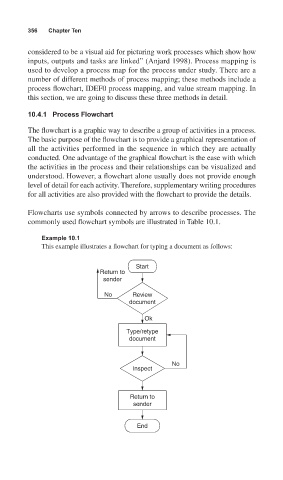
Example 10.1
This example illustrates a flowchart for typing a document as follows:
Start
Return to
sender
No Review
document
Ok
Type/retype
document
No
Inspect
Return to
sender
End