
Page 438 - Design for Six Sigma for Service (Six SIGMA Operational Methods)
P. 438
396 Chapter Eleven
620
600
Film thickness 580
560
540
520
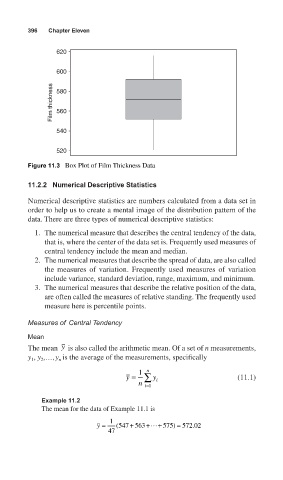
Figure 11.3 Box Plot of Film Thickness Data
11.2.2 Numerical Descriptive Statistics
Numerical descriptive statistics are numbers calculated from a data set in
order to help us to create a mental image of the distribution pattern of the
data. There are three types of numerical descriptive statistics:
1. The numerical measure that describes the central tendency of the data,
that is, where the center of the data set is. Frequently used measures of
central tendency include the mean and median.
2. The numerical measures that describe the spread of data, are also called
the measures of variation. Frequently used measures of variation
include variance, standard deviation, range, maximum, and minimum.
3. The numerical measures that describe the relative position of the data,
are often called the measures of relative standing. The frequently used
measure here is percentile points.
Measures of Central Tendency
Mean
The mean y is also called the arithmetic mean. Of a set of n measurements,
y , y ,…,y is the average of the measurements, specifically
n
2
1
n
1
y = ∑ y (11.1)
n i=1 i
Example 11.2
The mean for the data of Example 11.1 is
y = 1 ( 547 + 563 +⋅⋅⋅+ 575) = 572 02.
47