
Page 441 - Design for Six Sigma for Service (Six SIGMA Operational Methods)
P. 441
Statistical Basics and Six Sigma Metrics 399
A very commonly used measure of relative standing is the 100pth per-
centile, or simply called percentile points.
The 100pth percentile of a data set is a value y located so that 100p percent
of the data is smaller than y, and 100(1 – p)% of the data is larger than y,
where 0 ≤ p ≤ 1.
Example 11.7
The median is the 50th percentile, because 50 percent of data points are
smaller than the median and 50 percent of data are larger than the median. The
25 percent percentile is often called the lower quartile and is denoted by Q L or
Q 1 ; 25 percent of data will be smaller than Q L and 75 percent of data will be
larger than Q L in a given data set. The 75th percentile is often called the upper
quartile and is denoted by Q U or Q 3 ; 75 percent of data will be smaller than Q U
and 25 percent of data will be larger than Q U .
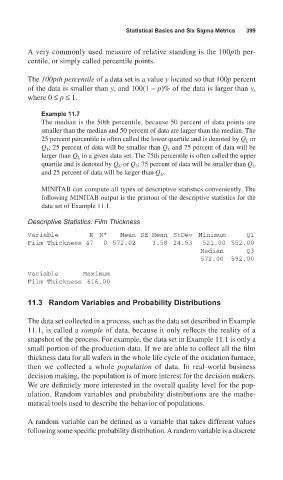
MINITAB can compute all types of descriptive statistics conveniently. The
following MINITAB output is the printout of the descriptive statistics for the
data set of Example 11.1.
Descriptive Statistics: Film Thickness
Variable N N* Mean SE Mean StDev Minimum Q1
Film Thickness 47 0 572.02 3.58 24.53 521.00 552.00
Median Q3
572.00 592.00
Variable Maximum
Film Thickness 616.00
11.3 Random Variables and Probability Distributions
The data set collected in a process, such as the data set described in Example
11.1, is called a sample of data, because it only reflects the reality of a
snapshot of the process. For example, the data set in Example 11.1 is only a
small portion of the production data. If we are able to collect all the film
thickness data for all wafers in the whole life cycle of the oxidation furnace,
then we collected a whole population of data. In real-world business
decision making, the population is of more interest for the decision makers.
We are definitely more interested in the overall quality level for the pop-
ulation. Random variables and probability distributions are the mathe-
matical tools used to describe the behavior of populations.
A random variable can be defined as a variable that takes different values
following some specific probability distribution. A random variable is a discrete