
Page 437 - Design for Six Sigma for Service (Six SIGMA Operational Methods)
P. 437
Statistical Basics and Six Sigma Metrics 395
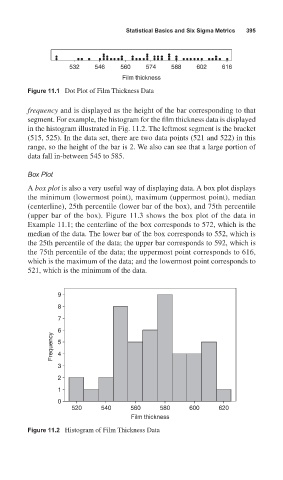
532 546 560 574 588 602 616
Film thickness
Figure 11.1 Dot Plot of Film Thickness Data
frequency and is displayed as the height of the bar corresponding to that
segment. For example, the histogram for the film thickness data is displayed
in the histogram illustrated in Fig. 11.2. The leftmost segment is the bracket
(515, 525). In the data set, there are two data points (521 and 522) in this
range, so the height of the bar is 2. We also can see that a large portion of
data fall in-between 545 to 585.
Box Plot
A box plot is also a very useful way of displaying data. A box plot displays
the minimum (lowermost point), maximum (uppermost point), median
(centerline), 25th percentile (lower bar of the box), and 75th percentile
(upper bar of the box). Figure 11.3 shows the box plot of the data in
Example 11.1; the centerline of the box corresponds to 572, which is the
median of the data. The lower bar of the box corresponds to 552, which is
the 25th percentile of the data; the upper bar corresponds to 592, which is
the 75th percentile of the data; the uppermost point corresponds to 616,
which is the maximum of the data; and the lowermost point corresponds to
521, which is the minimum of the data.
9
8
7
6
Frequency 5
4
3
2
1
0
520 540 560 580 600 620
Film thickness
Figure 11.2 Histogram of Film Thickness Data