
Page 432 - Design for Six Sigma for Service (Six SIGMA Operational Methods)
P. 432
390 Chapter Ten
Utilization
Name 0% 25% 50% 75% 100%
PBX_OPERATOR
USSA_1.1
USSA_1.2
USSA_1
FIELD_INSPECTOR
USAA3_COMPLEX
USAA2_COMPLEX
USAA4_COMPLEX
USAA_NEG1
USAA_NEG2
USAA2_SIMPLE
USAA3_SIMPLE
USAA_5_COMPLEX
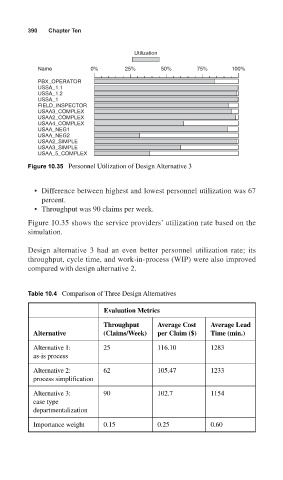
Figure 10.35 Personnel Utilization of Design Alternative 3
• Difference between highest and lowest personnel utilization was 67
percent.
• Throughput was 90 claims per week.
Figure 10.35 shows the service providers’ utilization rate based on the
simulation.
Design alternative 3 had an even better personnel utilization rate; its
throughput, cycle time, and work-in-process (WIP) were also improved
compared with design alternative 2.
Table 10.4 Comparison of Three Design Alternatives
Evaluation Metrics
Throughput Average Cost Average Lead
Alternative (Claims/Week) per Claim ($) Time (min.)
Alternative 1: 25 116.10 1283
as-is process
Alternative 2: 62 105.47 1233
process simplification
Alternative 3: 90 102.7 1154
case type
departmentalization
Importance weight 0.15 0.25 0.60