
Page 430 - Design for Six Sigma for Service (Six SIGMA Operational Methods)
P. 430
388 Chapter Ten
Utilization
Name 0% 25% 50% 75% 100%
P_SCREEN_ROUTE_MAIL
P_IDENTIFY_CUSTOMER
P_DOCUMENT_LOSS_REPORT
P_OPEN_COVERAGES
P_OBTAIN_STATEMENTS INFORMATION
REV_L_R_DPVD
FIELD_INSPECTOR_1
FIELD_INSPECTOR_2
P_DETERMINE_COVERAGE
P_ASSESS_MED_INJURY_DAMAGES_
P_DETERMINE_CASUALTY
P_CONTROL_MONETARY_VALUE_OF_LOSS
P_WHAT_PART_OF_LOSS_IS_COVERED
P_DETERMINE_FAULT
P_TAKE_ACTION
P_MAKE_OFFER_REACH_AGREEMENT
P_DEVELOP_STRATEGY
P_VAA
P_OBTAIN_DOCUMENTS
P_DETERMINE_CAUSE_OF_LOSS
P_CLOSE_FILE
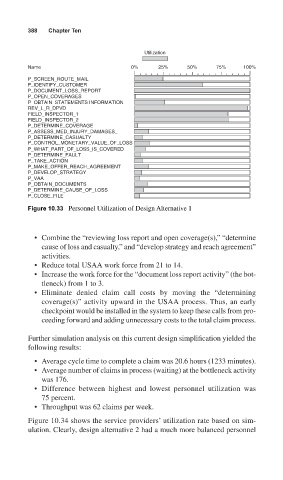
Figure 10.33 Personnel Utilization of Design Alternative 1
• Combine the “reviewing loss report and open coverage(s),” “determine
cause of loss and casualty,” and “develop strategy and reach agreement”
activities.
• Reduce total USAA work force from 21 to 14.
• Increase the work force for the “document loss report activity” (the bot-
tleneck) from 1 to 3.
• Eliminate denied claim call costs by moving the “determining
coverage(s)” activity upward in the USAA process. Thus, an early
checkpoint would be installed in the system to keep these calls from pro-
ceeding forward and adding unnecessary costs to the total claim process.
Further simulation analysis on this current design simplification yielded the
following results:
• Average cycle time to complete a claim was 20.6 hours (1233 minutes).
• Average number of claims in process (waiting) at the bottleneck activity
was 176.
• Difference between highest and lowest personnel utilization was
75 percent.
• Throughput was 62 claims per week.
Figure 10.34 shows the service providers’ utilization rate based on sim-
ulation. Clearly, design alternative 2 had a much more balanced personnel