
Page 428 - Design for Six Sigma for Service (Six SIGMA Operational Methods)
P. 428
386 Chapter Ten
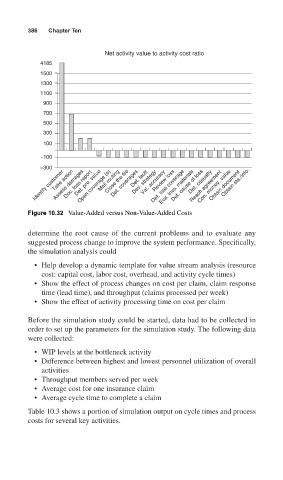
Net activity value to activity cost ratio
4185
1500
1300
1100
900
700
500
300
100
−100
−300
Obtain sta./info.
Close the file
Dev. strategy
Det. coverages
Assess damages
Det. pre. value
Open coverage (s)
Take action
Det. loss coverage
Det. cause of loss
Review loss
Identify customer Doc. loss report Mail routing Det. fault Val. accuracy Eva. invs. materials Det. casualty Obtain document
Con. money. value
Reach agreement
Figure 10.32 Value-Added versus Non-Value-Added Costs
determine the root cause of the current problems and to evaluate any
suggested process change to improve the system performance. Specifically,
the simulation analysis could
• Help develop a dynamic template for value stream analysis (resource
cost: capital cost, labor cost, overhead, and activity cycle times)
• Show the effect of process changes on cost per claim, claim response
time (lead time), and throughput (claims processed per week)
• Show the effect of activity processing time on cost per claim
Before the simulation study could be started, data had to be collected in
order to set up the parameters for the simulation study. The following data
were collected:
• WIP levels at the bottleneck activity
• Difference between highest and lowest personnel utilization of overall
activities
• Throughput members served per week
• Average cost for one insurance claim
• Average cycle time to complete a claim
Table 10.3 shows a portion of simulation output on cycle times and process
costs for several key activities.