
Page 424 - Design for Six Sigma for Service (Six SIGMA Operational Methods)
P. 424
382 Chapter Ten
Taking loss report (steps 1, 2, 3) Loss investigation (steps 4, 5, 6, 7, 8)
Step 1 Step 2 Step 3 Step 4 Step 5 Step 6 Step 7
Screen & Identify Document Review Open Obtain Obtain
route mail customer loss report loss report coverage statements/ documents
info.
Determine exposure (steps 9, 10, 11)
Step 10 Step 9 Step 8
Determine
Determine Evaluate preliminary
cause inv. value
of loss materials of damages
Step 12
Step 11 Assess medical
CAgreed Determine injury and
coverage physical
damages
No Yes
Step 13
End Determine Evaluate damages
causality (steps 12, 13, 14)
Step 15 Step 14
Determine Control
what part of monetary
loss is value
covered of loss
Evaluate liability (steps 15, 16)
Step 16
Determine
fault
Negotiate claim
(steps 17, 18)
Conclude claim (steps 19, 20, 21)
Step 18 Step 20
Step 17 Step 19 Validate Step 21
Develop Make offer Take action accuracy Close the End
and reach
strategy as agreed and file
agreement appropri.
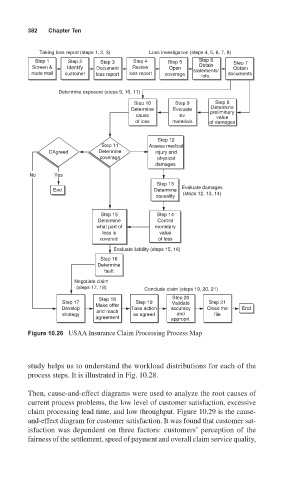
Figure 10.26 USAA Insurance Claim Processing Process Map
study helps us to understand the workload distributions for each of the
process steps. It is illustrated in Fig. 10.28.
Then, cause-and-effect diagrams were used to analyze the root causes of
current process problems, the low level of customer satisfaction, excessive
claim processing lead time, and low throughput. Figure 10.29 is the cause-
and-effect diagram for customer satisfaction. It was found that customer sat-
isfaction was dependent on three factors: customers’ perception of the
fairness of the settlement, speed of payment and overall claim service quality,