
Page 429 - Design for Six Sigma for Service (Six SIGMA Operational Methods)
P. 429
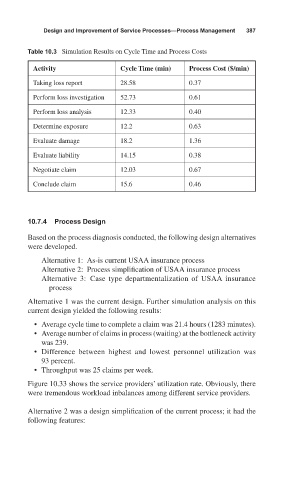
Design and Improvement of Service Processes—Process Management  387

        Table 10.3 Simulation Results on Cycle Time and Process Costs

          Activity               Cycle Time (min)  Process Cost ($/min)
          Taking loss report     28.58             0.37

          Perform loss investigation  52.73        0.61
          Perform loss analysis  12.33             0.40
          Determine exposure     12.2              0.63

          Evaluate damage        18.2              1.36
          Evaluate liability     14.15             0.38
          Negotiate claim        12.03             0.67

          Conclude claim         15.6              0.46


        10.7.4  Process Design
        Based on the process diagnosis conducted, the following design alternatives
        were developed.
            Alternative 1: As-is current USAA insurance process
            Alternative 2: Process simplification of USAA insurance process
            Alternative 3: Case type departmentalization of USAA insurance
              process
        Alternative 1 was the current design. Further simulation analysis on this
        current design yielded the following results:

          • Average cycle time to complete a claim was 21.4 hours (1283 minutes).
          • Average number of claims in process (waiting) at the bottleneck activity
            was 239.
          • Difference between highest and lowest personnel utilization was
            93 percent.
          • Throughput was 25 claims per week.
        Figure 10.33 shows the service providers’ utilization rate. Obviously, there
        were tremendous workload inbalances among different service providers.

        Alternative 2 was a design simplification of the current process; it had the
        following features: