
Page 431 - Design for Six Sigma for Service (Six SIGMA Operational Methods)
P. 431
Design and Improvement of Service Processes—Process Management 389
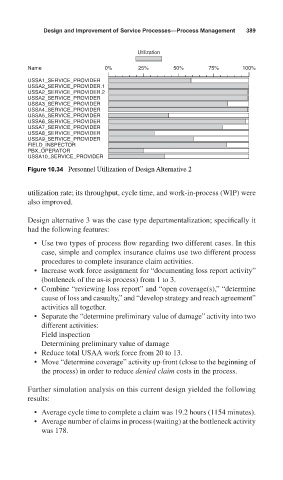
Utilization
Name 0% 25% 50% 75% 100%
USSA1_SERVICE_PROVIDER
USSA2_SERVICE_PROVIDER.1
USSA2_SERVICE_PROVIDER.2
USSA2_SERVICE_PROVIDER
USSA3_SERVICE_PROVIDER
USSA4_SERVICE_PROVIDER
USSA5_SERVICE_PROVIDER
USSA6_SERVICE_PROVIDER
USSA7_SERVICE_PROVIDER
USSA8_SERVICE_PROVIDER
USSA9_SERVICE_PROVIDER
FIELD_INSPECTOR
PBX_OPERATOR
USSA10_SERVICE_PROVIDER
Figure 10.34 Personnel Utilization of Design Alternative 2
utilization rate; its throughput, cycle time, and work-in-process (WIP) were
also improved.
Design alternative 3 was the case type departmentalization; specifically it
had the following features:
• Use two types of process flow regarding two different cases. In this
case, simple and complex insurance claims use two different process
procedures to complete insurance claim activities.
• Increase work force assignment for “documenting loss report activity”
(bottleneck of the as-is process) from 1 to 3.
• Combine “reviewing loss report” and “open coverage(s),” “determine
cause of loss and casualty,” and “develop strategy and reach agreement”
activities all together.
• Separate the “determine preliminary value of damage” activity into two
different activities:
Field inspection
Determining preliminary value of damage
• Reduce total USAA work force from 20 to 13.
• Move “determine coverage” activity up-front (close to the beginning of
the process) in order to reduce denied claim costs in the process.
Further simulation analysis on this current design yielded the following
results:
• Average cycle time to complete a claim was 19.2 hours (1154 minutes).
• Average number of claims in process (waiting) at the bottleneck activity
was 178.