
Page 426 - Design for Six Sigma for Service (Six SIGMA Operational Methods)
P. 426
384 Chapter Ten
and information about the claim process. All these three factors depended on
how much time relevant service providers worked with the customers. If
there was an uneven workload among the service providers, some of the
providers would be too busy and have very little time to explain to customers.
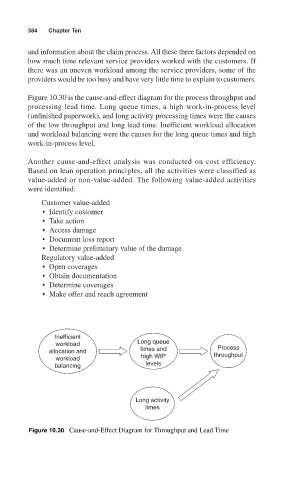
Figure 10.30 is the cause-and-effect diagram for the process throughput and
processing lead time. Long queue times, a high work-in-process level
(unfinished paperwork), and long activity processing times were the causes
of the low throughput and long lead time. Inefficient workload allocation
and workload balancing were the causes for the long queue times and high
work-in-process level.
Another cause-and-effect analysis was conducted on cost efficiency.
Based on lean operation principles, all the activities were classified as
value-added or non-value-added. The following value-added activities
were identified:
Customer value-added
• Identify customer
• Take action
• Access damage
• Document loss report
• Determine preliminary value of the damage
Regulatory value-added
• Open coverages
• Obtain documentation
• Determine coverages
• Make offer and reach agreement
Inefficient
workload Long queue
Process
allocation and times and throughput
workload high WIP
balancing levels
Long activity
times
Figure 10.30 Cause-and-Effect Diagram for Throughput and Lead Time