
Page 452 - Design for Six Sigma for Service (Six SIGMA Operational Methods)
P. 452
410 Chapter Eleven
the total spread of the specification is six times the standard deviation on
each side of the mean. For a Six Sigma quality level,
C = USL − LSL = 12s = 2
p 6s 6s
By using the normal probability distribution, it can be computed that
P(y will be in specification) = P(LSL ≤ y ≤ USL) = P(−6 ≤ z ≤ 6)
= 0.999999998 = 99.9999998%
Clearly, P(y will be out of specification) =1 – 0.9999999998 = 0.000000002,
or 0.002 defective parts per million. Similarly, if the spread of specification
is 5 times s on each side of the mean, it is called 5 sigma quality.
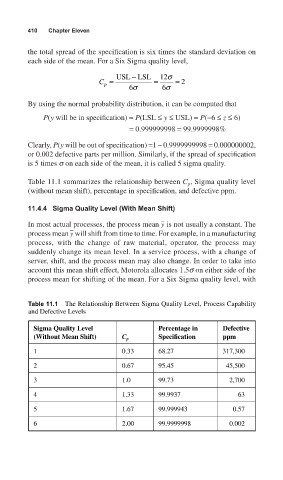
Table 11.1 summarizes the relationship between C , Sigma quality level
p
(without mean shift), percentage in specification, and defective ppm.
11.4.4 Sigma Quality Level (With Mean Shift)
_
In most actual processes, the process mean y is not usually a constant. The
_
process mean y will shift from time to time. For example, in a manufacturing
process, with the change of raw material, operator, the process may
suddenly change its mean level. In a service process, with a change of
server, shift, and the process mean may also change. In order to take into
account this mean shift effect, Motorola allocates 1.5s on either side of the
process mean for shifting of the mean. For a Six Sigma quality level, with
Table 11.1 The Relationship Between Sigma Quality Level, Process Capability
and Defective Levels
Sigma Quality Level Percentage in Defective
(Without Mean Shift) C p Specification ppm
1 0.33 68.27 317,300
2 0.67 95.45 45,500
3 1.0 99.73 2,700
4 1.33 99.9937 63
5 1.67 99.999943 0.57
6 2.00 99.9999998 0.002