
Page 451 - Design for Six Sigma for Service (Six SIGMA Operational Methods)
P. 451
Statistical Basics and Six Sigma Metrics 409
Process capability of film thickness
LSL USL
Process data Within
LSL 460.00000 Overall
Target *
Potential (within) capability
USL 660.00000
Sample mean 572.02128 Cp 1.35
Sample?N 47 CPL 1.51
StDev (within) 24.66804 CPU 1.19
StDev (overall) 24.66804 Cpk 1.19
CCpk 1.35
Overall capability
Pp 1.35
PPL 1.51
PPU 1.19
Ppk 1.19
Cpm *
480 510 540 570 600 630 660
Observed performance Exp. within performance Exp. overall performance
PPM?<?LSL 0.00 PPM?<?LSL 2.80 PPM?<?LSL 2.80
PPM?>?USL 0.00 PPM?>?USL 180.89 PPM?>?USL 180.89
PPM?Total 0.00 PPM?Total 183.68 PPM?Total 183.68
11.4.3 Sigma Quality Level (Without Mean Shift)
In 1988, the Motorola Corporation was the winner of the Malcolm Baldrige
National Quality Award. Motorola bases much of its quality effort on its Six
Sigma program. The goal of this program was to reduce the variation in
every process to such an extent that a spread of 12s (6s on each side of the
mean) fits within the process specification limits.
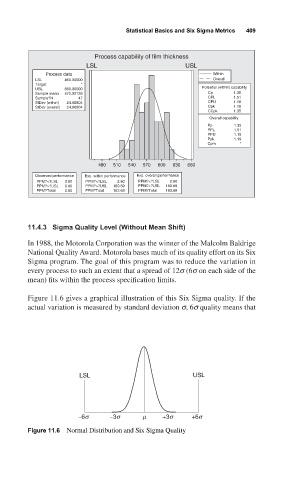
Figure 11.6 gives a graphical illustration of this Six Sigma quality. If the
actual variation is measured by standard deviation s,6s quality means that
LSL USL
−6s −3s m +3s +6s
Figure 11.6 Normal Distribution and Six Sigma Quality