
Page 453 - Design for Six Sigma for Service (Six SIGMA Operational Methods)
P. 453
Statistical Basics and Six Sigma Metrics 411
4.5 1.5 1.5 4.5
sigma sigma sigma sigma
LSL USL
Process
mean
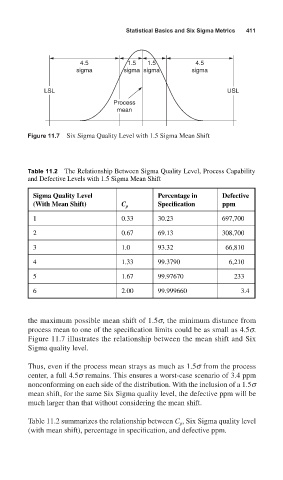
Figure 11.7 Six Sigma Quality Level with 1.5 Sigma Mean Shift
Table 11.2 The Relationship Between Sigma Quality Level, Process Capability
and Defective Levels with 1.5 Sigma Mean Shift
Sigma Quality Level Percentage in Defective
(With Mean Shift) C p Specification ppm
1 0.33 30.23 697,700
2 0.67 69.13 308,700
3 1.0 93.32 66,810
4 1.33 99.3790 6,210
5 1.67 99.97670 233
6 2.00 99.999660 3.4
the maximum possible mean shift of 1.5s, the minimum distance from
process mean to one of the specification limits could be as small as 4.5s.
Figure 11.7 illustrates the relationship between the mean shift and Six
Sigma quality level.
Thus, even if the process mean strays as much as 1.5s from the process
center, a full 4.5s remains. This ensures a worst-case scenario of 3.4 ppm
nonconforming on each side of the distribution. With the inclusion of a 1.5s
mean shift, for the same Six Sigma quality level, the defective ppm will be
much larger than that without considering the mean shift.
Table 11.2 summarizes the relationship between C , Six Sigma quality level
p
(with mean shift), percentage in specification, and defective ppm.