
Page 237 - Design of Simple and Robust Process Plants
P. 237
6.2 Basic Theory of Reliability 223
The term function may appear simple in the case of a catastrophic failure, where it is
easy to determine. A switch no longer works, so an electric device (e.g. a pump)
cannot be started or stopped. In case of a drift failure, the function might under-
mine the performance and result in a catastrophic failure if no action is taken. An
example is a vibrating pump which should be repaired before its ultimate failure.
The time duration ± also called mission time ± is a dominating factor. For a process
plant this is the time between turn-arounds, and must not be confused with process
stops for regeneration or cleaning. The time is an important aspect, as the reliability
of components generally decreases with time. The reduction in reliability might also
be affected by usage rather than time; for example, in the case of switches this
would be the total number of times that they are operated, or in the case of a car, the
mileage covered. In general, time is used as bases for comparison of reliability in
the process industry, although it might be possible also to differentiate for specific
units. For particular items that are subject to predictive/preventive maintenance
(e.g. high-voltage power switches), repair regimes are often developed based on
usage.
The environment will also have an impact on reliability; for example, an electric
driver exposed to high temperature and corrosive atmosphere might fail earlier. The
limitations are the number of data points available to determine the failure rates to a
significant level. Due to this constraint, the environment is often broader than
might be preferred.
Probability is the likelihood of occurrence of an event or a sequence of events dur-
ing an interval of time, or the likelihood of success or failure of an event on test or
on demand. Probability is expressed between zero and unity.
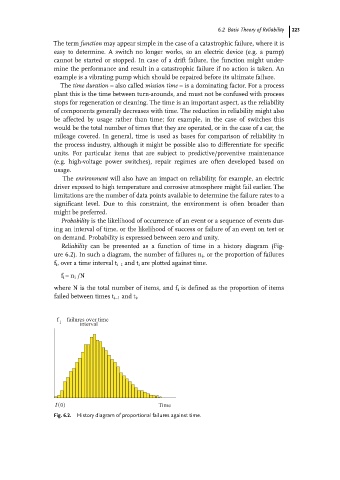
Reliability can be presented as a function of time in a history diagram (Fig-
ure 6.2). In such a diagram, the number of failures n i , or the proportion of failures
f i , over a time interval t i±1 and t i are plotted against time.
f i =n i /N
where N is the total number of items, and f i is defined as the proportion of items
failed between times t i±1 and t i .
f failures over time
i interval
t( ) 0 Time
Fig. 6.2. History diagram of proportional failures against time.