
Page 238 - Design of Simple and Robust Process Plants
P. 238
224 Chapter 6 Process Design Based on Reliability
F proportion of items survived and failed at time t
i
1.0
Time
0
t()
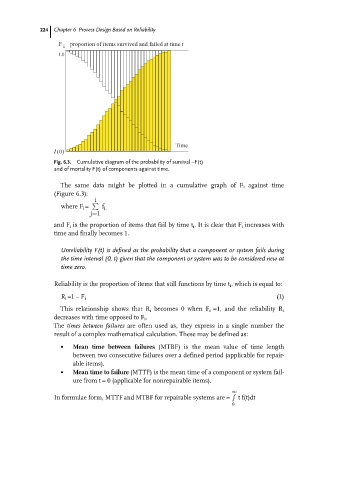
Fig. 6.3. Cumulative diagram of the probability of survival ±F(t)
and of mortality F(t) of components against time.
The same data might be plotted in a cumulative graph of F i against time
(Figure 6.3):
P i
where F i = f j,
j1
and F i is the proportion of items that fail by time t i . It is clear that F i increases with
time and finally becomes 1.
Unreliability F(t) is defined as the probability that a component or system fails during
the time interval (0, t) given that the component or system was to be considered new at
time zero.
Reliability is the proportion of items that still functions by time t i , which is equal to:
R i =1 ± F i (1)
This relationship shows that R i becomes 0 when F i =1, and the reliability R i
decreases with time opposed to F i .
The times between failures are often used as, they express in a single number the
result of a complex mathematical calculation. These may be defined as:
. Mean time between failures (MTBF) is the mean value of time length
between two consecutive failures over a defined period (applicable for repair-
able items).
. Mean time to failure (MTTF) is the mean time of a component or system fail-
ure from t = 0 (applicable for nonrepairable items).
R 1
In formulae form, MTTF and MTBF for repairable systems are = t f(t)dt
0