
Page 317 - Design of Simple and Robust Process Plants
P. 317
8.3 Automation of Operation 303
The trajectories of the manipulated variables m h , w B and j v and the inlet temperature
are subject to evaluation, and the objective function is minimized by manipulating
these variables.
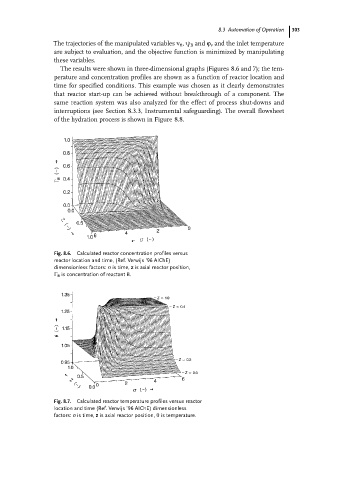
The results were shown in three-dimensional graphs (Figures 8.6 and 7); the tem-
perature and concentration profiles are shown as a function of reactor location and
time for specified conditions. This example was chosen as it clearly demonstrates
that reactor start-up can be achieved without breakthrough of a component. The
same reaction system was also analyzed for the effect of process shut-downs and
interruptions (see Section 8.3.3, Instrumental safeguarding). The overall flowsheet
of the hydration process is shown in Figure 8.8.
Fig. 8.6. Calculated reactor concentration profiles versus
reactor location and time, (Ref. Verwijs '96 AIChE)
dimensionless factors: r is time, z is axial reactor position,
C B is concentration of reactant B.
Fig. 8.7. Calculated reactor temperature profiles versus reactor
location and time (Ref. Verwijs '96 AIChE) dimensionless
factors: r is time, z is axial reactor position, h is temperature.