Page 383 - Design of Simple and Robust Process Plants
P. 383
370  Chapter 9 Operation Optimization

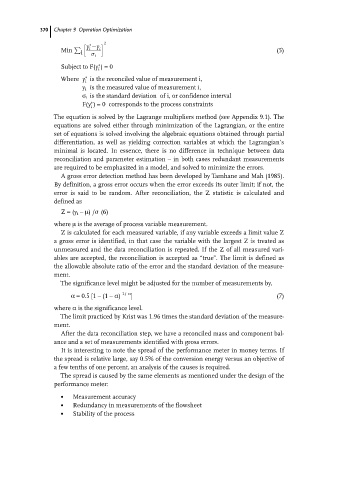
                      P y  y  i 2

                         h
                  Min   i  i  i                                                (5)
                             i
                  Subject to F(y )=0

                             i
                  Where y is the reconciled value of measurement i,

                         i
                        y i is the measured value of measurement i,
                        r i is the standard deviation of i, or confidence interval
                        F(y )= 0 corresponds to the process constraints

                           i
                The equation is solved by the Lagrange multipliers method (see Appendix 9.1). The
                equations are solved either through minimization of the Lagrangian, or the entire
                set of equations is solved involving the algebraic equations obtained through partial
                differentiation, as well as yielding correction variables at which the Lagrangian's
                minimal is located. In essence, there is no difference in technique between data
                reconciliation and parameter estimation ± in both cases redundant measurements
                are required to be emphasized in a model, and solved to minimize the errors.
                  A gross error detection method has been developed by Tamhane and Mah (1985).
                By definition, a gross error occurs when the error exceeds its outer limit; if not, the
                error is said to be random. After reconciliation, the Z statistic is calculated and
                defined as
                  Z=(y i ± l)/r (6)
                where l is the average of process variable measurement.
                  Z is calculated for each measured variable, if any variable exceeds a limit value Z
                a gross error is identified, in that case the variable with the largest Z is treated as
                unmeasured and the data reconciliation is repeated. If the Z of all measured vari-
                ables are accepted, the reconciliation is accepted as ªtrueº. The limit is defined as
                the allowable absolute ratio of the error and the standard deviation of the measure-
                ment.
                  The significance level might be adjusted for the number of measurements by,
                     a = 0.5 [1 ± (1 ± a)  1/ n ]                              (7)
                where a is the significance level.
                  The limit practiced by Krist was 1.96 times the standard deviation of the measure-
                ment.
                  After the data reconciliation step, we have a reconciled mass and component bal-
                ance and a set of measurements identified with gross errors.
                  It is interesting to note the spread of the performance meter in money terms. If
                the spread is relative large, say 0.5% of the conversion energy versus an objective of
                a few tenths of one percent, an analysis of the causes is required.
                  The spread is caused by the same elements as mentioned under the design of the
                performance meter:

                  .   Measurement accuracy
                  .   Redundancy in measurements of the flowsheet
                  .   Stability of the process

