
Page 428 - Design of Simple and Robust Process Plants
P. 428
10.2Continuous Improvement of a High-quality Plant 415
The objective of simple and robust plant is hands-off operation. The analysis of the
events is to identify the areas for improvement of control and operational software
to reduce operator intervention. The same type of analysis can be applied for field
operation; in that particular case the operator's activities must be registered as man-
ual and analyzed for improvements.
The described activities should lead to an inventory of potential process improve-
ments to achieve simple and robust operation. The event-tracking must be a daily
activity of the day supervisor, watching for problems and opportunities to keep the
operation simple and robust.
10.2.4
Optimal Operation
For optimal operation we need two different tools: a continuous plant performance
measurement (profit meter); and an optimization model.
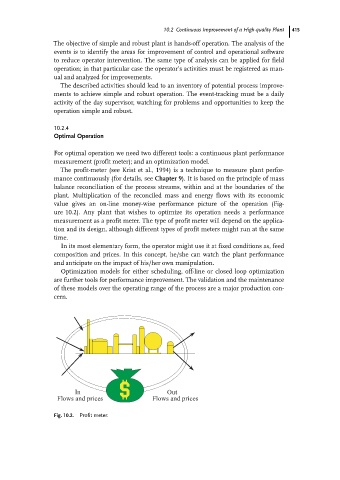
The profit-meter (see Krist et al., 1994) is a technique to measure plant perfor-
mance continuously (for details, see Chapter 9). It is based on the principle of mass
balance reconciliation of the process streams, within and at the boundaries of the
plant. Multiplication of the reconciled mass and energy flows with its economic
value gives an on-line money-wise performance picture of the operation (Fig-
ure 10.2). Any plant that wishes to optimize its operation needs a performance
measurement as a profit meter. The type of profit meter will depend on the applica-
tion and its design, although different types of profit meters might run at the same
time.
In its most elementary form, the operator might use it at fixed conditions as, feed
composition and prices. In this concept, he/she can watch the plant performance
and anticipate on the impact of his/her own manipulation.
Optimization models for either scheduling, off-line or closed loop optimization
are further tools for performance improvement. The validation and the maintenance
of these models over the operating range of the process are a major production con-
cern.
In Out
Flows and prices Flows and prices
Fig. 10.2. Profit meter.