
Page 100 - Design of Solar Thermal Power Plants
P. 100
88 2. THE SOLAR RESOURCE AND METEOROLOGICAL PARAMETERS
0.9
0.85
0.8
a+b
0.75
0.7
0.65
0 1 2 3 4 5 6 7 8 9 101112
month
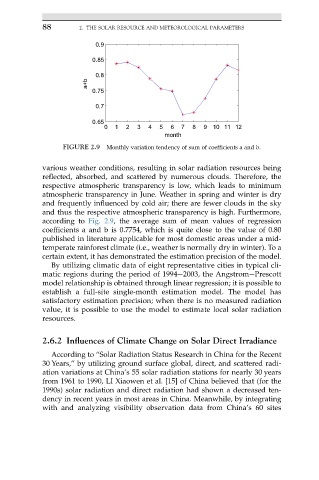
FIGURE 2.9 Monthly variation tendency of sum of coefficients a and b.
various weather conditions, resulting in solar radiation resources being
reflected, absorbed, and scattered by numerous clouds. Therefore, the
respective atmospheric transparency is low, which leads to minimum
atmospheric transparency in June. Weather in spring and winter is dry
and frequently influenced by cold air; there are fewer clouds in the sky
and thus the respective atmospheric transparency is high. Furthermore,
according to Fig. 2.9, the average sum of mean values of regression
coefficients a and b is 0.7754, which is quite close to the value of 0.80
published in literature applicable for most domestic areas under a mid-
temperate rainforest climate (i.e., weather is normally dry in winter). To a
certain extent, it has demonstrated the estimation precision of the model.
By utilizing climatic data of eight representative cities in typical cli-
matic regions during the period of 1994e2003, the AngstromePrescott
model relationship is obtained through linear regression; it is possible to
establish a full-site single-month estimation model. The model has
satisfactory estimation precision; when there is no measured radiation
value, it is possible to use the model to estimate local solar radiation
resources.
2.6.2 Influences of Climate Change on Solar Direct Irradiance
According to “Solar Radiation Status Research in China for the Recent
30 Years,” by utilizing ground surface global, direct, and scattered radi-
ation variations at China’s 55 solar radiation stations for nearly 30 years
from 1961 to 1990, LI Xiaowen et al. [15] of China believed that (for the
1990s) solar radiation and direct radiation had shown a decreased ten-
dency in recent years in most areas in China. Meanwhile, by integrating
with and analyzing visibility observation data from China’s 60 sites