
Page 98 - Design of Solar Thermal Power Plants
P. 98
86 2. THE SOLAR RESOURCE AND METEOROLOGICAL PARAMETERS
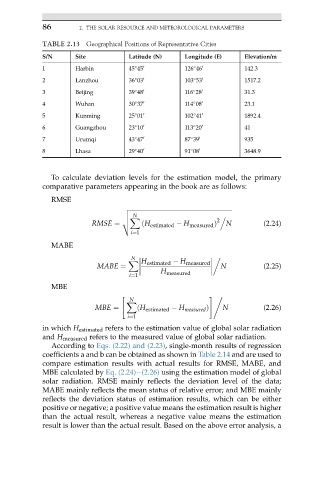
TABLE 2.13 Geographical Positions of Representative Cities
S/N Site Latitude (N) Longitude (E) Elevation/m
1 Harbin 45 45 0 126 46 0 142.3
2 Lanzhou 36 03 0 103 53 0 1517.2
3 Beijing 39 48 0 116 28 0 31.3
4 Wuhan 30 37 0 114 08 0 23.1
5 Kunming 25 01 0 102 41 0 1892.4
6 Guangzhou 23 10 0 113 20 0 41
7 Urumqi 43 47 0 87 39 0 935
8 Lhasa 29 40 0 91 08 0 3648.9
To calculate deviation levels for the estimation model, the primary
comparative parameters appearing in the book are as follows:
RMSE
v ffiffiffiffiffiffiffiffiffiffiffiffiffiffiffiffiffiffiffiffiffiffiffiffiffiffiffiffiffiffiffiffiffiffiffiffiffiffiffiffiffiffiffiffiffiffiffiffiffiffiffiffiffiffiffiffiffiffiffiffiffiffiffiffiffiffiffi
N
u
.
2
u X
RMSE ¼ t ðH estimated H measured Þ N (2.24)
i¼1
MABE
N
X H estimated H measured
MABE ¼ N (2.25)
H measured
i¼1
MBE
" #,
N
X
MBE ¼ ðH estimated H measured Þ N (2.26)
i¼1
in which H estimated refers to the estimation value of global solar radiation
and H measured refers to the measured value of global solar radiation.
According to Eqs. (2.22) and (2.23), single-month results of regression
coefficients a and b can be obtained as shown in Table 2.14 and are used to
compare estimation results with actual results for RMSE, MABE, and
MBE calculated by Eq. (2.24)e(2.26) using the estimation model of global
solar radiation. RMSE mainly reflects the deviation level of the data;
MABE mainly reflects the mean status of relative error; and MBE mainly
reflects the deviation status of estimation results, which can be either
positive or negative; a positive value means the estimation result is higher
than the actual result, whereas a negative value means the estimation
result is lower than the actual result. Based on the above error analysis, a