
Page 99 - Design of Solar Thermal Power Plants
P. 99
2.6 SOLAR IRRADIANCE PREDICTION METHODS 87
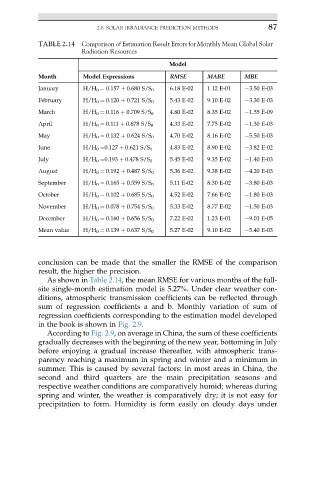
TABLE 2.14 Comparison of Estimation Result Errors for Monthly Mean Global Solar
Radiation Resources
Model
Month Model Expressions RMSE MABE MBE
January H/H 0 ¼ 0.157 þ 0.680 S/S 0 6.18 E-02 1.12 E-01 3.50 E-03
February H/H 0 ¼ 0.120 þ 0.721 S/S 0 5.43 E-02 9.10 E-02 3.30 E-03
March H/H 0 ¼ 0.116 þ 0.709 S/S 0 4.80 E-02 8.35 E-02 1.55 E-09
April H/H 0 ¼ 0.111 þ 0.678 S/S 0 4.33 E-02 7.75 E-02 1.30 E-03
May H/H 0 ¼ 0.132 þ 0.624 S/S 0 4.70 E-02 8.16 E-02 5.50 E-03
June H/H 0 ¼0.127 þ 0.621 S/S 0 4.83 E-02 8.90 E-02 3.82 E-02
July H/H 0 ¼0.193 þ 0.478 S/S 0 5.45 E-02 9.35 E-02 1.40 E-03
August H/H 0 ¼ 0.192 þ 0.487 S/S 0 5.36 E-02 9.38 E-02 4.20 E-03
September H/H 0 ¼ 0.165 þ 0.559 S/S 0 5.11 E-02 8.30 E-02 3.80 E-03
October H/H 0 ¼ 0.102 þ 0.685 S/S 0 4.52 E-02 7.66 E-02 1.80 E-03
November H/H 0 ¼ 0.078 þ 0.754 S/S 0 5.33 E-02 8.77 E-02 1.50 E-03
December H/H 0 ¼ 0.160 þ 0.656 S/S 0 7.22 E-02 1.23 E-01 9.01 E-05
Mean value H/H 0 ¼ 0.139 þ 0.637 S/S 0 5.27 E-02 9.10 E-02 5.40 E-03
conclusion can be made that the smaller the RMSE of the comparison
result, the higher the precision.
As shown in Table 2.14, the mean RMSE for various months of the full-
site single-month estimation model is 5.27%. Under clear weather con-
ditions, atmospheric transmission coefficients can be reflected through
sum of regression coefficients a and b. Monthly variation of sum of
regression coefficients corresponding to the estimation model developed
in the book is shown in Fig. 2.9.
According to Fig. 2.9, on average in China, the sum of these coefficients
gradually decreases with the beginning of the new year, bottoming in July
before enjoying a gradual increase thereafter, with atmospheric trans-
parency reaching a maximum in spring and winter and a minimum in
summer. This is caused by several factors: in most areas in China, the
second and third quarters are the main precipitation seasons and
respective weather conditions are comparatively humid; whereas during
spring and winter, the weather is comparatively dry; it is not easy for
precipitation to form. Humidity is form easily on cloudy days under