
Page 93 - Design of Solar Thermal Power Plants
P. 93
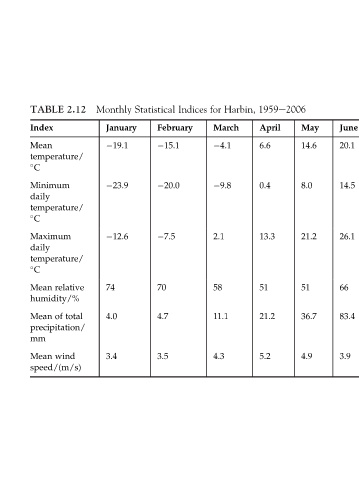
June December November  October September  August  July   15.3   5.7  5.4  14.3  20.9  22.6  20.1   19.8   10.1  0.5  9.0  16.4  18.3  14.5   9.5   0.0  12.0  20.8  26.4  27.9  26.1  73  67  65  71  78  77  66  5.9  9.4  25.6  61.5  112.5  155.0  83.4  4.7  4.3  4.1  3.6  3.2  3.5  3.9


                        May  14.6  8.0      21.2     51   36.7   4.9
                     1959e2006  April  6.6  0.4  13.3  51  21.2  5.2


                     Harbin,


                     for  March   4.1   9.8  2.1     58   11.1   4.3
                     Indices  February


                     Statistical   15.1   20.0   7.5  70  4.7    3.5


                     Monthly  January   19.1   23.9   12.6  74  4.0  3.4


                     2.12                            relative  total  wind
                     TABLE  Index  Mean  temperature/    C  Minimum  daily  temperature/    C  Maximum  daily  temperature/    C  Mean  humidity/%  of  Mean  precipitation/  mm  Mean  speed/(m/s)