
Page 90 - Design of Solar Thermal Power Plants
P. 90
2.5 DISTRIBUTION OF THE SOLAR RESOURCE IN SEVERAL 79
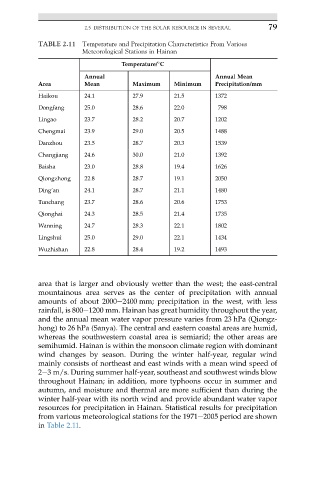
TABLE 2.11 Temperature and Precipitation Characteristics From Various
Meteorological Stations in Hainan
Temperature/ C
Annual Annual Mean
Area Mean Maximum Minimum Precipitation/mm
Haikou 24.1 27.9 21.5 1372
Dongfang 25.0 28.6 22.0 798
Lingao 23.7 28.2 20.7 1202
Chengmai 23.9 29.0 20.5 1488
Danzhou 23.5 28.7 20.3 1539
Changjiang 24.6 30.0 21.0 1392
Baisha 23.0 28.8 19.4 1626
Qiongzhong 22.8 28.7 19.1 2050
Ding’an 24.1 28.7 21.1 1480
Tunchang 23.7 28.6 20.6 1753
Qionghai 24.3 28.5 21.4 1735
Wanning 24.7 28.3 22.1 1802
Lingshui 25.0 29.0 22.1 1434
Wuzhishan 22.8 28.4 19.2 1493
area that is larger and obviously wetter than the west; the east-central
mountainous area serves as the center of precipitation with annual
amounts of about 2000e2400 mm; precipitation in the west, with less
rainfall, is 800e1200 mm. Hainan has great humidity throughout the year,
and the annual mean water vapor pressure varies from 23 hPa (Qiongz-
hong) to 26 hPa (Sanya). The central and eastern coastal areas are humid,
whereas the southwestern coastal area is semiarid; the other areas are
semihumid. Hainan is within the monsoon climate region with dominant
wind changes by season. During the winter half-year, regular wind
mainly consists of northeast and east winds with a mean wind speed of
2e3 m/s. During summer half-year, southeast and southwest winds blow
throughout Hainan; in addition, more typhoons occur in summer and
autumn, and moisture and thermal are more sufficient than during the
winter half-year with its north wind and provide abundant water vapor
resources for precipitation in Hainan. Statistical results for precipitation
from various meteorological stations for the 1971e2005 period are shown
in Table 2.11.