
Page 224 - Design of Solar Thermal Power Plants
P. 224
3.7 CALCULATION OF ANNUAL POWER GENERATION 207
3.000 3.000
Simulation time = 1.00 h
2.400 2.400
Flowrate /(kg/s) 1.800 1.800
1.200
1.200
0.600 0.600
0.000 0.000
0.0000 0.0833 0.1667 0.2500 0.3333 0.4167 0.5000 0.5833 0.6667 0.7500 0.8333 0.9167 1.0000
Thermal discharging time /h
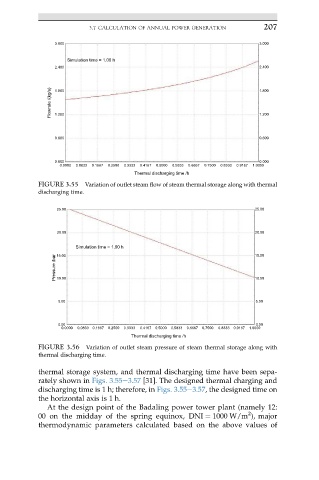
FIGURE 3.55 Variation of outlet steam flow of steam thermal storage along with thermal
discharging time.
25.00 25.00
20.00 20.00
Simulation time = 1.00 h 15.00
Pressure /bar 10.00 10.00
15.00
5.00 5.00
0.00 0.00
0.0000 0.0833 0.1667 0.2500 0.3333 0.4167 0.5000 0.5833 0.6667 0.7500 0.8333 0.9167 1.0000
Thermal discharging time /h
FIGURE 3.56 Variation of outlet steam pressure of steam thermal storage along with
thermal discharging time.
thermal storage system, and thermal discharging time have been sepa-
rately shown in Figs. 3.55e3.57 [31]. The designed thermal charging and
discharging time is 1 h; therefore, in Figs. 3.55e3.57, the designed time on
the horizontal axis is 1 h.
At the design point of the Badaling power tower plant (namely 12:
2
00 on the midday of the spring equinox, DNI ¼ 1000 W/m ), major
thermodynamic parameters calculated based on the above values of