
Page 278 - Design of Solar Thermal Power Plants
P. 278
260 4. DESIGN OF THE CONCENTRATION SYSTEM
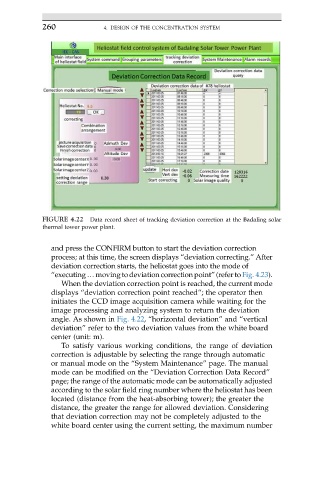
FIGURE 4.22 Data record sheet of tracking deviation correction at the Badaling solar
thermal tower power plant.
and press the CONFIRM button to start the deviation correction
process; at this time, the screen displays “deviation correcting.” After
deviation correction starts, the heliostat goes into the mode of
“executing . moving todeviation correction point” (refer to Fig. 4.23).
When the deviation correction point is reached, the current mode
displays “deviation correction point reached”; the operator then
initiates the CCD image acquisition camera while waiting for the
image processing and analyzing system to return the deviation
angle. As shown in Fig. 4.22, “horizontal deviation” and “vertical
deviation” refer to the two deviation values from the white board
center (unit: m).
To satisfy various working conditions, the range of deviation
correction is adjustable by selecting the range through automatic
or manual mode on the “System Maintenance” page. The manual
mode can be modified on the “Deviation Correction Data Record”
page; the range of the automatic mode can be automatically adjusted
according to the solar field ring number where the heliostat has been
located (distance from the heat-absorbing tower); the greater the
distance, the greater the range for allowed deviation. Considering
that deviation correction may not be completely adjusted to the
white board center using the current setting, the maximum number