Page 242 - Digital Analysis of Remotely Sensed Imagery
P. 242

206    Cha pte r  S i x


                            255
                                                          f


                           DN
                             out


                                 θ
                             0
                              0                            255
                                             DN
                                               in
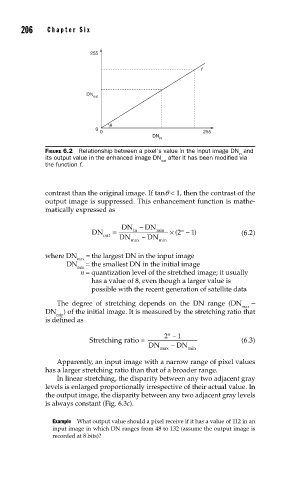
               FIGURE 6.2  Relationship between a pixel’s value in the input image DN  and
                                                                    in
               its output value in the enhanced image DN  after it has been modifi ed via
                                               out
               the function f.

               contrast than the original image. If tanq < 1, then the contrast of the
               output image is suppressed. This enhancement function is mathe-
               matically expressed as

                                    DN −   DN
                                                       1
                            DN    =     in    min  × (2 n  − )       (6.2)
                               out        −
                                    DN     DN
                                       max     min
               where DN    = the largest DN in the input image
                        max
                     DN    = the smallest DN in the initial image
                        min
                         n =  quantization level of the stretched image; it usually
                            has a value of 8, even though a larger value is
                            possible with the recent generation of satellite data
                   The degree of stretching depends on the DN range (DN  −
                                                                     max
               DN   ) of the initial image. It is measured by the stretching ratio that
                  min
               is defined as
                                                2 −  1
                                                 n
                            Stretching ratio =                       (6.3)
                                            DN    − DN
                                               max     min
                   Apparently, an input image with a narrow range of pixel values
               has a larger stretching ratio than that of a broader range.
                   In linear stretching, the disparity between any two adjacent gray
               levels is enlarged proportionally irrespective of their actual value. In
               the output image, the disparity between any two adjacent gray levels
               is always constant (Fig. 6.3c).

                 Example  What output value should a pixel receive if it has a value of 112 in an
                 input image in which DN ranges from 48 to 132 (assume the output image is
                 recorded at 8 bits)?
   237   238   239   240   241   242   243   244   245   246   247