
Page 247 - Digital Analysis of Remotely Sensed Imagery
P. 247
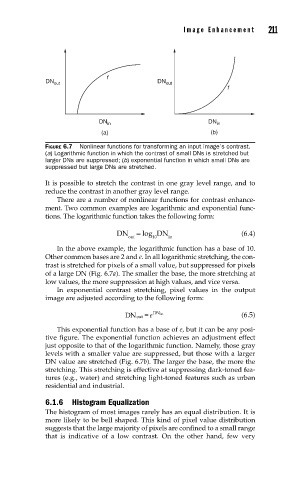
Image Enhancement       211


                                f
               DN out                         DN out
                                                                 f


                              DN in                         DN in
                               (a)                           (b)

               FIGURE 6.7  Nonlinear functions for transforming an input image’s contrast.
               (a) Logarithmic function in which the contrast of small DNs is stretched but
               larger DNs are suppressed; (b) exponential function in which small DNs are
               suppressed but large DNs are stretched.

               It is possible to stretch the contrast in one gray level range, and to
               reduce the contrast in another gray level range.
                   There are a number of nonlinear functions for contrast enhance-
               ment. Two common examples are logarithmic and exponential func-
               tions. The logarithmic function takes the following form:

                                   DN   = log DN                     (6.4)
                                      out    10  in
                    In the above example,  the logarithmic function has a base of 10.
               Other common bases are 2 and e. In all logarithmic stretching,  the con-
               trast is stretched for pixels of a small value,  but suppressed for pixels
               of a large DN (Fig. 6.7a). The smaller the base,  the more stretching at
               low values,  the more suppression at high values,  and vice versa.
                   In exponential contrast stretching, pixel values in the output
               image are adjusted according to the following form:

                                     DN out  = e  DN in              (6.5)

                   This exponential function has a base of e, but it can be any posi-
               tive figure. The exponential function achieves an adjustment effect
               just opposite to that of the logarithmic function. Namely, those gray
               levels with a smaller value are suppressed, but those with a larger
               DN value are stretched (Fig. 6.7b). The larger the base, the more the
               stretching. This stretching is effective at suppressing dark-toned fea-
               tures (e.g., water) and stretching light-toned features such as urban
               residential and industrial.

               6.1.6 Histogram Equalization
               The histogram of most images rarely has an equal distribution. It is
               more likely to be bell shaped. This kind of pixel value distribution
               suggests that the large majority of pixels are confined to a small range
               that is indicative of a low contrast. On the other hand, few very