
Page 300 - Distillation theory
P. 300
P1: JPJ/FFX P2: FCH/FFX QC: FCH/FFX T1: FCH
0521820928c08 CB644-Petlyuk-v1 June 11, 2004 20:20
274 Synthesis of Separation Flowsheets
a) %
180
160
1
140
120 2
100
80
60
40 3
20
0 N
0 20 40 60 80 100 120 132
b)
C 3
i-C 5 n-C 5 i-C 6 i-C 4
C −C 6
3
n-C 4
n-C 6
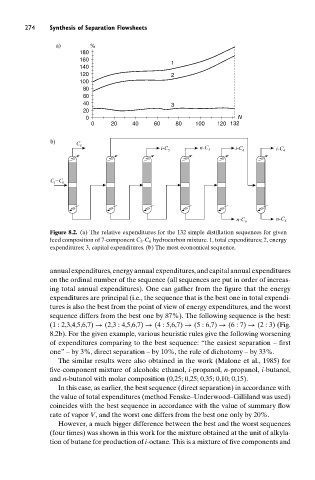
Figure 8.2. (a) The relative expenditures for the 132 simple distillation sequences for given
feed composition of 7-component C 3 -C 6 hydrocarbon mixture. 1, total expenditures; 2, energy
expenditures; 3, capital expenditures. (b) The most economical sequence.
annual expenditures, energy annual expenditures, and capital annual expenditures
on the ordinal number of the sequence (all sequences are put in order of increas-
ing total annual expenditures). One can gather from the figure that the energy
expenditures are principal (i.e., the sequence that is the best one in total expendi-
tures is also the best from the point of view of energy expenditures, and the worst
sequence differs from the best one by 87%). The following sequence is the best:
(1 : 2,3,4,5,6,7) → (2,3 : 4,5,6,7) → (4 : 5,6,7) → (5 : 6,7) → (6:7) → (2:3)(Fig.
8.2b). For the given example, various heuristic rules give the following worsening
of expenditures comparing to the best sequence: “the easiest separation –first
one”– by 3%, direct separation – by 10%, the rule of dichotomy – by 33%.
The similar results were also obtained in the work (Malone et al., 1985) for
five-component mixture of alcohols: ethanol, i-propanol, n-propanol, i-butanol,
and n-butanol with molar composition (0,25; 0,25; 0,35; 0,10; 0,15).
In this case, as earlier, the best sequence (direct separation) in accordance with
the value of total expenditures (method Fenske–Underwood–Gilliland was used)
coincides with the best sequence in accordance with the value of summary flow
rate of vapor V, and the worst one differs from the best one only by 20%.
However, a much bigger difference between the best and the worst sequences
(four times) was shown in this work for the mixture obtained at the unit of alkyla-
tion of butane for production of i-octane. This is a mixture of five components and