
Page 335 - Distillation theory
P. 335
P1: JPJ/FFX P2: FCH/FFX QC: FCH/FFX T1: FCH
0521820928c08 CB644-Petlyuk-v1 June 11, 2004 20:20
8.6 Binary and Three-Component Azeotropic Mixtures 309
2 ) 1 (
x
D
a)
x F ) 1 (
) 0 (
x
F
p 2
p 2
p 1
x B ) 2 ( = x F ) 3 (
p 1
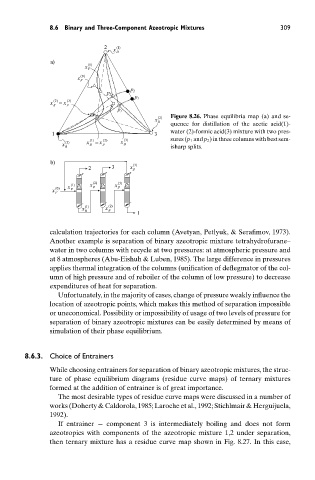
x ) 2 ( Figure 8.26. Phase equilibria map (a) and se-
D
quence for distillation of the acetic acid(1)-
1 3 water (2)-formic acid(3) mixture with two pres-
) 1 ( = ) 2 ( ) 3 ( sures (p 1 and p 2 ) in three columns with best sem-
) 3 ( x x x
x B F D
B isharp splits.
b)
2 3 x D ) 3 (
x F ) 0 ( x F ) 1 ( p 1 x F ) 2 ( p 2 x F ) 3 ( p 1
x ) 1 ( x ) 2 (
B B
1
calculation trajectories for each column (Avetyan, Petlyuk, & Serafimov, 1973).
Another example is separation of binary azeotropic mixture tetrahydrofurane–
water in two columns with recycle at two pressures: at atmospheric pressure and
at 8 atmospheres (Abu-Eishuh & Luben, 1985). The large difference in pressures
applies thermal integration of the columns (unification of deflegmator of the col-
umn of high pressure and of reboiler of the column of low pressure) to decrease
expenditures of heat for separation.
Unfortunately, in the majority of cases, change of pressure weakly influence the
location of azeotropic points, which makes this method of separation impossible
or uneconomical. Possibility or impossibility of usage of two levels of pressure for
separation of binary azeotropic mixtures can be easily determined by means of
simulation of their phase equilibrium.
8.6.3. Choice of Entrainers
While choosing entrainers for separation of binary azeotropic mixtures, the struc-
ture of phase equilibrium diagrams (residue curve maps) of ternary mixtures
formed at the addition of entrainer is of great importance.
The most desirable types of residue curve maps were discussed in a number of
works (Doherty & Caldorola, 1985; Laroche et al., 1992; Stichlmair & Herguijuela,
1992).
If entrainer − component 3 is intermediately boiling and does not form
azeotropics with components of the azeotropic mixture 1,2 under separation,
then ternary mixture has a residue curve map shown in Fig. 8.27. In this case,