
Page 49 - Distillation theory
P. 49
P1: FCH/FFX P2: FCH/FFX QC: VINOD/IYP T1: FCH
0521820928c02 CB644-Petlyuk-v1 June 11, 2004 17:58
2.2 Geometric Interpretation of Binary Distillation 23
The system [Eq. (2.1) ÷ (2.4)] may have a large number of equations. First,
the number of theoretical trays N may be enormous. Second, number of compo-
nents n may also be very large. For example, petroleum contains thousands of
components, which actually, for practical reasons, will be combined into tens of
pseudocomponents (or fractions).
The system [Eq. (2.1) ÷ (2.4)] may be solved only by iteration, and the so-
lution is not always immediately obtained, so it requires a high degree of initial
approximation. As a result of the system [Eq. (2.1) ÷ (2.4)] solution at the preset
number of theoretical trays in each section, we get not only the compositions of
products x iD and x iB , but also the compositions on all trays x ij and y ij − profiles
of concentrations along the column length, or distillation trajectories, that come
to be the basic subject of this book.
2.2. Geometric Interpretation of Binary Distillation:
Reflux and the Number of Trays
2.2.1. McCabe-Thiele Diagram
Geometric interpretation is extremely important for the understanding of distil-
lation process. In this relation, binary distillation gives us particularly large pos-
sibilities. Only for binary distillation are we able to show in a flat diagram the
composition of both liquid and vapor (curves y 1 − x 1 ).
This gives us an opportunity to understand easily some general regularities of
the distillation: the dependence of the required number of trays upon the reflux
ratio for a preset separation (preset purity of products), as well as the fact that
under a preset separation the reflux ratio and the number of trays cannot be less
than some minimum values (R min and n min ).
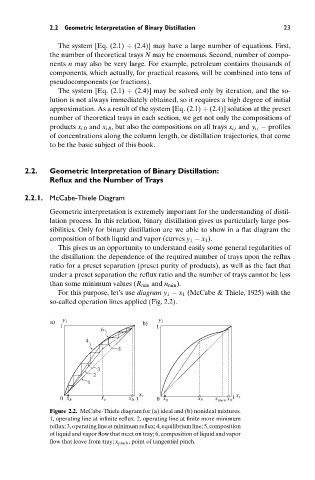
For this purpose, let’s use diagram y 1 − x 1 (McCabe & Thiele, 1925) with the
so-called operation lines applied (Fig. 2.2).
a) y 1 b) y 1
1 1
6
4
5
3
2
1
0 x B x F x D 1 x 1 0 x B x F x pinch x D 1 x 1
Figure 2.2. McCabe-Thiele diagram for (a) ideal and (b) nonideal mixtures.
1, operating line at infinite reflux. 2, operating line at finite more minimum
reflux; 3, operating line at minimum reflux; 4, equilibrium line; 5, composition
of liquid and vapor flow that meet on tray; 6, composition of liquid and vapor
flow that leave from tray; x pinch , point of tangential pinch.