
Page 315 - Distributed model predictive control for plant-wide systems
P. 315
Operation Optimization of Multitype Cooling Source System Based on DMPC 289
800
After steady optimization
Existing method
Money consumed per half an hour(RMB Yuan) 500
700
600
400
300
200
100
0
5:00 6:00 7:00 8:00 9:00 10:00 11:00
Time
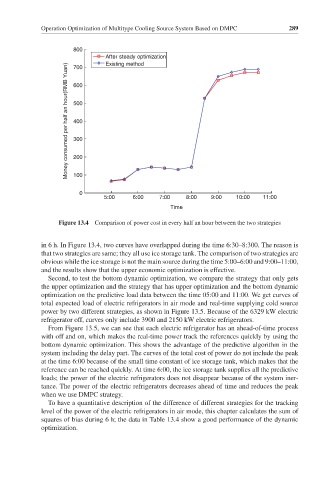
Figure 13.4 Comparison of power cost in every half an hour between the two strategies
in 6 h. In Figure 13.4, two curves have overlapped during the time 6:30–8:300. The reason is
that two strategies are same; they all use ice storage tank. The comparison of two strategies are
obvious while the ice storage is not the main source during the time 5:00–6:00 and 9:00–11:00,
and the results show that the upper economic optimization is effective.
Second, to test the bottom dynamic optimization, we compare the strategy that only gets
the upper optimization and the strategy that has upper optimization and the bottom dynamic
optimization on the predictive load data between the time 05:00 and 11:00. We get curves of
total expected load of electric refrigerators in air mode and real-time supplying cold source
power by two different strategies, as shown in Figure 13.5. Because of the 6329 kW electric
refrigerator off, curves only include 3900 and 2150 kW electric refrigerators.
From Figure 13.5, we can see that each electric refrigerator has an ahead-of-time process
with off and on, which makes the real-time power track the references quickly by using the
bottom dynamic optimization. This shows the advantage of the predictive algorithm in the
system including the delay part. The curves of the total cost of power do not include the peak
at the time 6:00 because of the small time constant of ice storage tank, which makes that the
reference can be reached quickly. At time 6:00, the ice storage tank supplies all the predictive
loads; the power of the electric refrigerators does not disappear because of the system iner-
tance. The power of the electric refrigerators decreases ahead of time and reduces the peak
when we use DMPC strategy.
To have a quantitative description of the difference of different strategies for the tracking
level of the power of the electric refrigerators in air mode, this chapter calculates the sum of
squares of bias during 6 h; the data in Table 13.4 show a good performance of the dynamic
optimization.