
Page 250 - Dust Explosions in the Process Industries
P. 250
222 Dust Explosions in the Process Industries
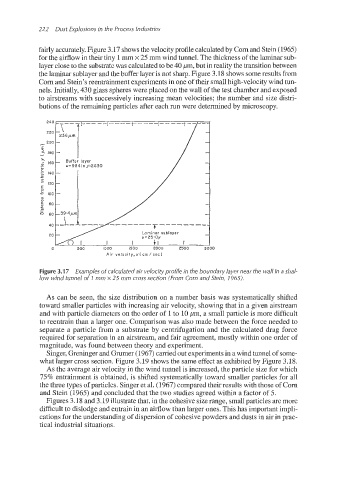
fairly accurately.Figure 3.17 shows the velocity profile calculatedby Corn and Stein (1965)
for the airflow in their tiny 1nxn x 25 mm wind tunnel. The thickness of the laminar sub-
layer close to the substratewas calculatedto be 40 pm, but in reality the transition between
the laminar sublayer and the buffer layer is not sharp. Figure 3.18 shows some results from
Corn and Stein’sreentrainment experimentsin one of their small high-velocity wind tun-
nels. Initially, 430 glass spheres were placed on the wall of the test chamber and exposed
to airstreams with successively increasing mean velocities; the number and size distri-
butions of the remaining particles after each run were determined by microscopy.
Air velocity, u( cm / sec I
Figure 3.1 7 Examples of calculated air velocity profile in the boundary layer near the wall in a shal-
low wind tunnel of l mm x 25 mm cross section (From Corn and Stein, 1965).
As can be seen, the size distribution on a number basis was systematically shifted
toward smaller particles with increasing air velocity, showing that in a given airstream
and with particle diameters on the order of 1 to 10 pm, a small particle is more difficult
to reentrain than a larger one. Comparison was also made between the force needed to
separate a particle from a substrate by centrifugation and the calculated drag force
required for separation in an airstream, and fair agreement,mostly within one order of
magnitude, was found between theory and experiment.
Singer, Greninger and Grumer (1967)carried out experimentsin a wind tunnel of some-
what larger cross section. Figure 3.19 shows the same effect as exhibited by Figure 3.18.
As the average air velocity in the wind tunnel is increased, the particle size for which
75% entrainment is obtained, is shifted systematically toward smaller particles for all
the three types of particles. Singer et al. (1 967) compared their results with those of Corn
and Stein (1965) and concluded that the two studies agreed within a factor of 5.
Figures 3.18 and 3.19 illustrate that, in the cohesive size range, smallparticles are more
difficult to dislodge and entrain in an airflow than larger ones. This has important impli-
cations for the understanding of dispersion of cohesivepowders and dusts in air in prac-
tical industrial situations.