
Page 258 - Dust Explosions in the Process Industries
P. 258
230 Dust Explosions in the Process Industries
3.6.3
ENTRAINMENT OF PARTICLES BY AN UPWARD AIRFLOW
THROUGH A PARTICLE BED
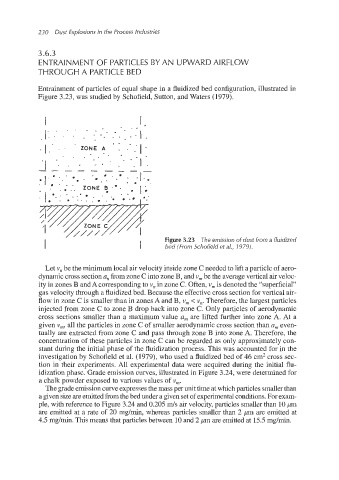
Entrainment of particles of equal shape in a fluidized bed configuration, illustrated in
Figure 3.23, was studied by Schofield, Sutton, and Waters (1979).
I ‘ -. - .. 1.
-.
1;: :I . .., .. .’.I.
.-
.I.‘ . . ‘ ZONE A . .+.’I.
. . . . . * .-
. I .
..
. .
-1 ..
_-_---___
’
*..e . * . . .** . -1..
.*I.# :. ,- -. .
. . . .. ZONE E.** e I;
.- 0 . . f ..
1 I bed (From Schofield et a/., 1979).
Figure 3.23 The emission of dust from a fluidized
Let v, be the minimum local air velocity inside zone C needed to lift a particle of aero-
dynamic cross section a, from zone C into zone B, and v, be the average vertical airveloc-
ity in zones B and A corresponding to v, in zone C. Often, v, is denoted the “superficial”
gas velocity through a fluidized bed. Because the effectivecross section for vertical air-
flow in zone C is smaller than in zones A and B, v, < y,. Therefore, the largest particles
injected from zone C to zone B drop back into zone C. Only particles of aerodynamic
cross sections smaller than a maximum value a, are lifted further into zone A. At a
given v,, all the particles in zone C of smaller aerodynamic cross section than a, even-
tually are extracted from zone C and pass through zone B into zone A. Therefore, the
concentration of these particles in zone C can be regarded as only approximately con-
stant during the initial phase of the fluidization process. This was accounted for in the
investigation by Schofield et al. (1979), who used a fluidized bed of 46 cm2cross sec-
tion in their experiments. All experimental data were acquired during the initial flu-
idization phase. Grade emission curves, illustrated in Figure 3.24, were determined for
a chalk powder exposed to various values of v,.
The grade emissioncurveexpressesthe mass per unit time at which particles smallerthan
a given size are emitted from the bed under a given set of experimental conditions.For exam-
ple, with reference to Figure 3.24 and 0.205 m/s airvelocity, particles smaller than 10 pm
are emitted at a rate of 20 mg/min, whereas particles smaller than 2 pm are emitted at
4.5 mg/min. This means that particles between 10 and 2 pm are emitted at 15.5 mg/min.