
Page 262 - Dust Explosions in the Process Industries
P. 262
234 Dust Explosions in the Process Industries
99.9
99
90
- 70
E 50
3
30
10
1
168 m/d\ \
0.1 I I 1 I I l l I
0.4 0.6 1 2 4 6 8 10 20 40
Effective particle size x [pml
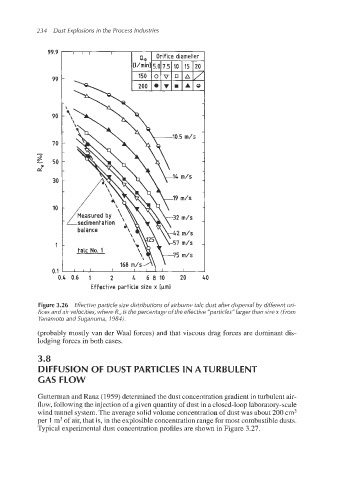
Figure 3.26 Effective particle size distributions of airborne talc dust after dispersal by different ori-
fices and air velocities, where R, is the percentage of the effective "particles"1arger than size x (From
Yanamoto and Suganuma, 7 984).
(probably mostly van der Waal forces) and that viscous drag forces are dominant dis-
lodging forces in both cases.
3.8
DIFFUSION OF DUST PARTICLES IN ATURBULENT
GAS FLOW
Gutterman and Ranz (1959) determined the dust concentration gradient in turbulent air-
flow, following the injection of a given quantity of dust in a closed-loop laboratory-scale
wind tunnel system. The average solid volume concentration of dust was about 200 cm3
per 1m3of air, that is, in the explosible concentration range for most combustible dusts.
Typical experimental dust concentration profiles are shown in Figure 3.27.