
Page 266 - Dust Explosions in the Process Industries
P. 266
238 Dust Explosions in the Process Industries
50,
m- E
kl
I
c
.-
0
+
m
+
L
c 01 I I I
(u
U c
8 1000,
I
c
v) 2.5 rn downstream of
2
U dust source
d
m
U
0
-1
I I I
0 0.05 0.10 0.15 0.20
Vertical distance from wind tunnel floor Iml
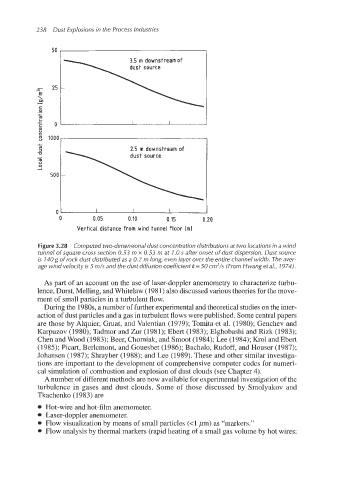
Figure 3.28 Computed two-dimensionaldust concentration distributionsat two locations in a wind
tunnel of square cross section 0.53 m x 0.53 m at 1.O s after onset of dust dispersion. Dust source
is 140 g of rock dust distributed as a 0.2 m long, even layer over the entire channel width. The aver-
age wind velocity is 5 m/s and the dust diffusion coefficient k= 50 cm2/s (From Hwang et a/., 1974).
As part of an account on the use of laser-doppler anemometry to characterize turbu-
lence, Durst, Melling, and Whitelaw (1981) also discussed various theories for the move-
ment of small particles in a turbulent flow.
During the 1980s,a number of furtherexperimental and theoretical studies on the inter-
action of dust particles and a gas in turbulent flowswere published. Some centralpapers
are those by Alquier, Gruat, and Valentian (1979); Tomita et al. (1980); Genchev and
Karpuzov (1980); Tadmor and Zur (1981); Ebert (1983); Elghobashi and Rzk (1983);
Chen and Wood (1983); Beer, Chomiak, and Smoot (1984); Lee (1984); Krol and Ebert
(1985); Picart, Berlemont, and Gouesbet (1986); Bachalo, Rudoff, and Houser (1987);
Johansen (1987); Shrayber (1988); and Lee (1989). These and other similar investiga-
tions are important to the development of comprehensive computer codes for numeri-
cal simulation of combustion and explosion of dust clouds (see Chapter 4).
A number of different methods are now availablefor experimentalinvestigationof the
turbulence in gases and dust clouds. Some of those discussed by Smolyakov and
Tkachenko (1983) are
Hot-wire and hot-film anemometer.
Laser-doppler anemometer.
Flow visualization by means of small particles (4pm) as “markers.”
Flow analysis by thermal markers (rapid heating of a small gas volume by hot wires: