
Page 351 - Dust Explosions in the Process Industries
P. 351
320 Dust Explosions in the Process Industries
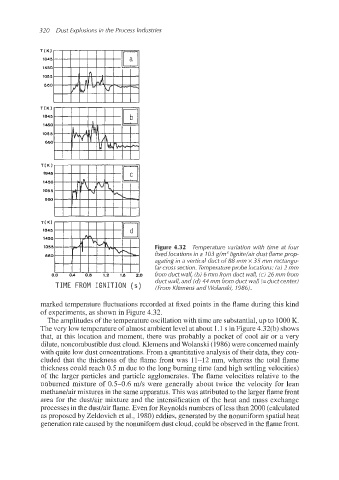
Figure 4.32 Temperature variation with time at four
fixed locations in a 103 g/m3 lignite/air dust flame prop-
agating in a vertical duct of 88 mm x 35 mm rectangu-
lar cross section. Temperatureprobe locations: (a) 2 mm
0.0 04 0.8 1.2 1.6 2.0 from duct wall, (b) 6 mm from duct wall, (c) 26 mm from
duct wall, and (d) 44 mm from duct wall (=duct center)
IGNITION (From Klemens and Wolanski, 1986).
marked temperature fluctuations recorded at fixed points in the flame during this kind
of experiments, as shown in Figure 4.32.
The amplitudes of the temperature oscillation with time are substantial, up to 1000 K.
The very low temperature of almost ambient level at about 1.1 s in Figure 4.32(b) shows
that, at this location and moment, there was probably a pocket of cool air or a very
dilute, noncombustible dust cloud. Klemens and Wolanski (1986) were concerned mainly
with quite low dust concentrations. From a quantitative analysis of their data, they con-
cluded that the thickness of the flame front was 11-12 mm, whereas the total flame
thickness could reach 0.5 m due to the long burning time (and high settling velocities)
of the larger particles and particle agglomerates. The flame velocities relative to the
unburned mixture of 0.5-0.6 m/s were generally about twice the velocity for lean
methane/air mixtures in the same apparatus. This was attributed to the larger flame front
area for the dust/air mixture and the intensification of the heat and mass exchange
processes in the dudair flame. Even for Reynolds numbers of less than 2000 (calculated
as proposed by Zeldovich et al., 1980) eddies, generated by the nonuniform spatial heat
generation rate caused by the nonuniform dust cloud, could be observed in the flame front.