
Page 355 - Dust Explosions in the Process Industries
P. 355
324 Dust Explosions in the Process Industries
P3
T 100 rnbar
I I
0.0 0.5 1.0 1.5 2.0 2.5 3.0
TIME FROM IGNITION [SI
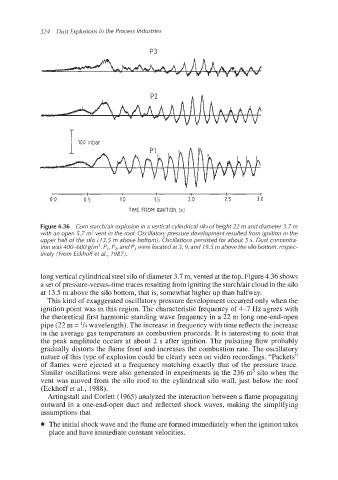
Figure 4.36 Corn starch/air explosion in a vertical cylindrical silo of height 22 m and diameter 3.7 m
with an open 5.7 m2 vent in the roof. Oscillatory pressure development resulted from ignition in the
upper half of the silo (13.5 m above bottom). Oscillations persisted for about 5 s. Dust concentra-
tion was 400-600 g/m3.P,, P2, and P3 were located at 3,9, and 7 9.5 m above the silo bottom, respec-
tively (From Eckhoff et ai., 1987).
long vertical cylindrical steel silo of diameter 3.7 m, vented at the top. Figure 4.36 shows
a set of pressure-versus-time traces resulting from igniting the starcldair cloud in the silo
at 13.5 m above the silo bottom, that is, somewhat higher up than halfway.
This kind of exaggerated oscillatory pressure development occurred only when the
ignition point was in this region. The characteristic frequency of 4-7 Hz agrees with
the theoretical first harmonic standing wave frequency in a 22 m long one-end-open
pipe (22 m = l/4 wavelength). The increase in frequency with time reflects the increase
in the average gas temperature as combustion proceeds. It is interesting to note that
the peak amplitude occurs at about 2 s after ignition. The pulsating flow probably
gradually distorts the flame front and increases the combustion rate. The oscillatory
nature of this type of explosion could be clearly seen on video recordings. “Packets”
of flames were ejected at a frequency matching exactly that of the pressure trace.
Similar oscillations were also generated in experiments in the 236 m3 silo when the
vent was moved from the silo roof to the cylindrical silo wall, just below the roof
(Eckhoff et al., 1988).
Artingstall and Corlett (1965) analyzed the interaction between a flame propagating
outward in a one-end-open duct and reflected shock waves, making the simplifying
assumptions that
The initial shock wave and the flame are formed immediately when the ignition takes
place and have immediate constant velocities.